Introduction
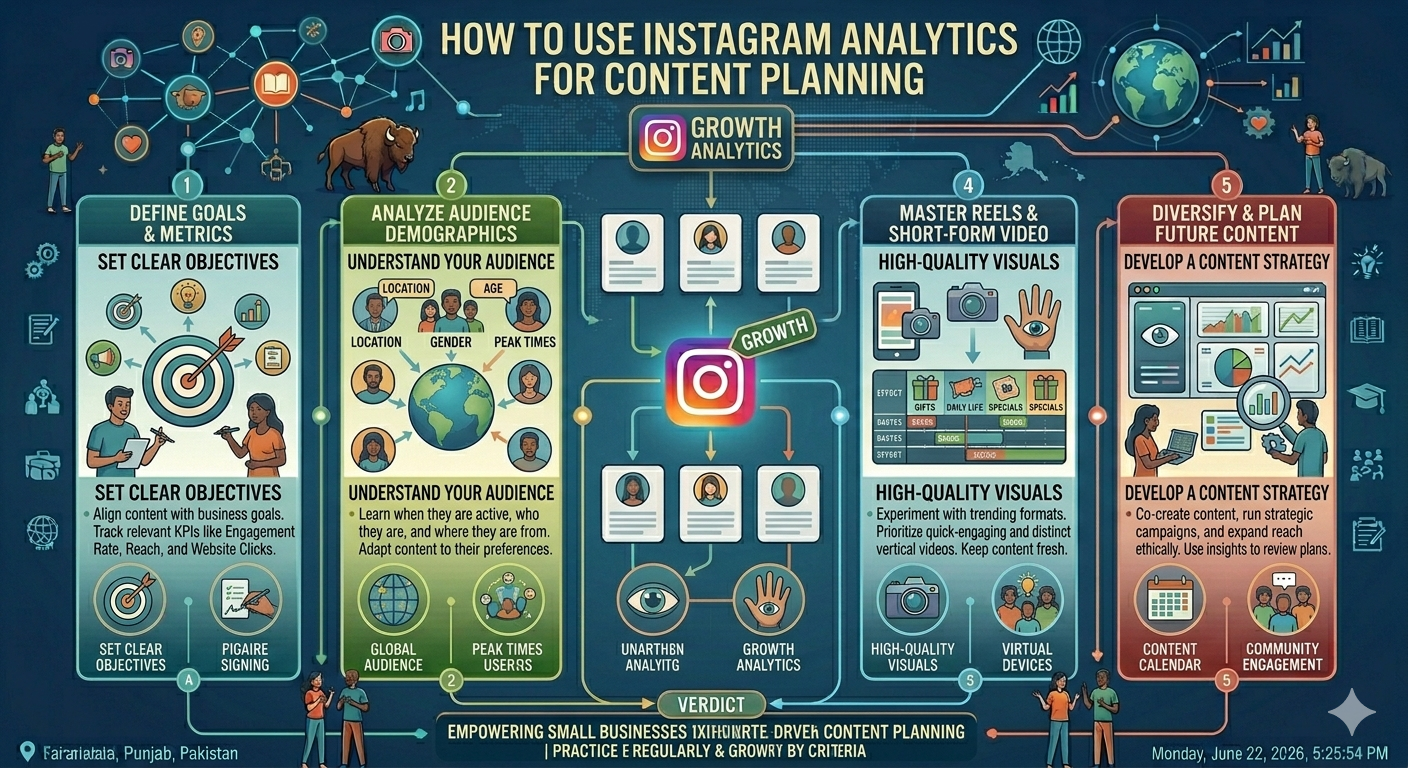
Most people check Instagram analytics after publishing content to see how it performed. Fewer people use analytics before creating content to decide what to make next. This second approach is where analytics become genuinely strategic rather than just a reporting exercise.
Using analytics for content planning means looking at past performance data and asking a specific set of forward looking questions. Which topics consistently drive the strongest engagement? Which formats generate the most saves? Which posting times show the strongest early reach? What does the audience appear to want more of based on how they have responded so far?
This guide covers how to build a practical content planning process grounded in analytics, combining your own account data with competitive research to produce a content calendar that is based on evidence rather than guesswork.
The Difference Between Reporting and Planning
Analytics used for reporting looks backward. It answers the question of what happened and presents that information to stakeholders.
Analytics used for planning looks backward to look forward. It uses past performance patterns to make better predictions about what will work in the future and informs specific decisions about what to create next.
The same data serves both purposes but requires a different set of questions. Reporting asks how did this perform. Planning asks what does this performance tell me about what I should create next.instapv
Step 1: Audit Your Last 30 Posts
Start every planning cycle with a content audit covering your most recent 30 posts. This sample size is large enough to reveal meaningful patterns while being recent enough to reflect current algorithm behavior and audience preferences.
For each post, note the content type, topic or theme, format, posting day and time, and key performance metrics including reach, engagement rate, and saves if available through your Insights dashboard.
Do not try to interpret individual posts at this stage. The goal is building a complete dataset that reveals patterns across the full sample rather than drawing conclusions from any single post.
Step 2: Identify Your Top Performing Content
Once the audit is complete, sort your posts by engagement rate and identify the top 20 percent. These are your highest performing posts across the recent period.
Look at these top performers as a group rather than individually. What do they have in common? Are they clustered around specific topics? Do they share a format, such as carousels, Reels, or single images? Do they share a structural approach, like list formats or question based openings? Are they concentrated in a particular posting time window?
The goal is finding patterns that are replicable rather than identifying one off successes that happened to perform well for reasons that cannot be systematically repeated.
Step 3: Identify Your Lowest Performing Content
Apply the same analysis to the bottom 20 percent of posts by engagement rate. Look for patterns here as well.
Do the lowest performers share topics that the audience seems uninterested in? Are they concentrated in a particular format that consistently underperforms for your account? Are they posted at times that consistently show weaker early engagement?
Both the top and bottom performers give you planning direction. Top performers tell you what to do more of. Bottom performers tell you what to adjust or stop doing.
Step 4: Analyze Format Performance Separately
Beyond topic and theme, format deserves its own separate analysis because the same topic can perform very differently depending on how it is presented.
Group your recent posts by format and calculate the average engagement rate for each group. Compare Reels against carousels against single images against any other formats you have used. This reveals which formats your specific audience responds to most strongly, which should directly influence the format mix in your content calendar going forward.
Step 5: Review Save Rate Patterns
Saves deserve specific attention in content planning because they are one of the strongest signals of content that provides lasting value and drives algorithmic distribution. As discussed throughout this series saves indicate that viewers found the content valuable enough to return to.
If your Insights data shows save counts for individual posts, identify which posts generated the highest save rates and analyze what they have in common. High save rate content is typically educational, practical, or reference worthy in some way. Understanding which specific topics and formats drive saves in your niche gives you a clear direction for creating content that performs well algorithmically over an extended period rather than just in the first 24 hours after posting.
Step 6: Map Audience Activity Patterns to Posting Times
As covered in Day 5's posting time guide, your audience activity data shows when your specific followers are most active by day and hour. Use this data to build a posting schedule that places content during your peak activity windows rather than at arbitrary times.
Review this data quarterly rather than setting it once and forgetting it, since audience activity patterns can shift as your account grows and your follower composition changes.
Step 7: Supplement With Competitive Research
Your own analytics data tells you what is working for your specific existing audience. Competitive research tells you what is working more broadly in your niche, including for audiences you have not yet reached.
Using InstaPV, review the content patterns and engagement trends of three to five successful accounts in your space. Note which formats and topics appear to be driving their strongest growth and engagement, then consider how to apply those insights to original content ideas in your own voice.
This combination of internal analytics and external competitive research produces a content planning foundation that is both grounded in your specific audience data and informed by broader niche performance patterns.
Step 8: Build Your Content Calendar
With your analytics insights gathered, translate them into a specific content calendar for the upcoming period, typically two to four weeks ahead.
Allocate your planned posts across your content pillars in proportions informed by performance data. If educational carousels consistently outperform other formats for your account, they should represent a larger share of your planned content than formats that have consistently underperformed.
Schedule posts at times informed by your audience activity data. Include a mix of formats, since format diversity still matters for reaching different segments of your audience and maintaining variety in how your feed appears to new profile visitors.
Leave some flexibility in the calendar for timely or reactive content opportunities rather than filling every slot in advance with no room for adaptation.
Step 9: Set Measurable Content Goals
Beyond simply planning what to post, define specific measurable goals for the upcoming content period. These might include a target average engagement rate, a minimum save count for educational content, or a specific reach figure for a planned Reel.
Having specific goals attached to your content plan creates accountability and gives you clear criteria for evaluating whether the analytics informed planning actually produced better results than previous periods without this structured approach.
Step 10: Review and Adjust After Each Planning Cycle
At the end of each planning period, review actual performance against your stated goals and against the previous period's performance. Did the analytics informed changes produce improvement? Which specific decisions produced the strongest results? What did not work as expected and why?
This review feeds directly into the next planning cycle, creating an iterative improvement loop where each content period builds on the learning from the previous one.
Using Analytics for Stories Specifically
Feed post analytics are the most commonly used for content planning, but Stories deserve their own analytics review. As covered in Day 6's Stories best practices post, completion rate and interactive element response rates reveal specific information about what keeps your Stories audience engaged and where you tend to lose viewers.
If your Stories analytics consistently show high exit rates at a specific point in your sequences, this is a planning signal to shorten sequences or strengthen the content at that point. If certain interactive formats consistently generate stronger response rates than others, this should influence how you structure future Stories content.
Common Analytics Planning Mistakes
Using too short a sample period is one of the most common mistakes. Analyzing only the last five or ten posts produces an unreliable picture because individual post variance is too high for short samples to show reliable patterns. Thirty posts minimum produces more actionable signal.
Reacting to individual outliers rather than patterns is another common error. A single post that significantly outperforms or underperforms your average does not necessarily indicate a strategic direction. Look for patterns across multiple examples before drawing planning conclusions.
Ignoring negative signals by only analyzing top performers misses half the available information. The bottom performers in your analytics contain equally important planning guidance about what to stop doing or change.
Frequently Asked Questions
Q: How often should I run this content planning process?
Monthly planning cycles work well for most accounts, combining a fresh analytics audit with a two to four week content calendar. Some accounts work on two week cycles for more agility, while accounts with very stable content strategies may work on longer six week cycles.
Q: What if my account is too new to have enough data for meaningful analytics planning?
New accounts with fewer than 20 to 30 posts should focus on posting a variety of content types across their defined pillars and treat the first two to three months as a data gathering period. Use competitive research through InstaPV to supplement the limited internal data during this period.
Q: Should I follow analytics data even if it conflicts with what I personally prefer to create?
Analytics should inform your content strategy but not dictate it entirely. If a content format consistently outperforms others but you find it creatively unsustainable, finding a version of that format you can maintain over time is a better solution than either forcing yourself to produce content you dislike or ignoring the performance signal entirely.
Q: Can I use InstaPV analytics data for competitor accounts in my content planning process?
Yes. InstaPV provides follower growth and engagement rate data for any public account, which is useful for understanding which competitor content approaches are currently driving the strongest results in your niche. This supplements but does not replace your own account's internal analytics data.
- Instagram for Small Business: A Complete Beginners Guide
-
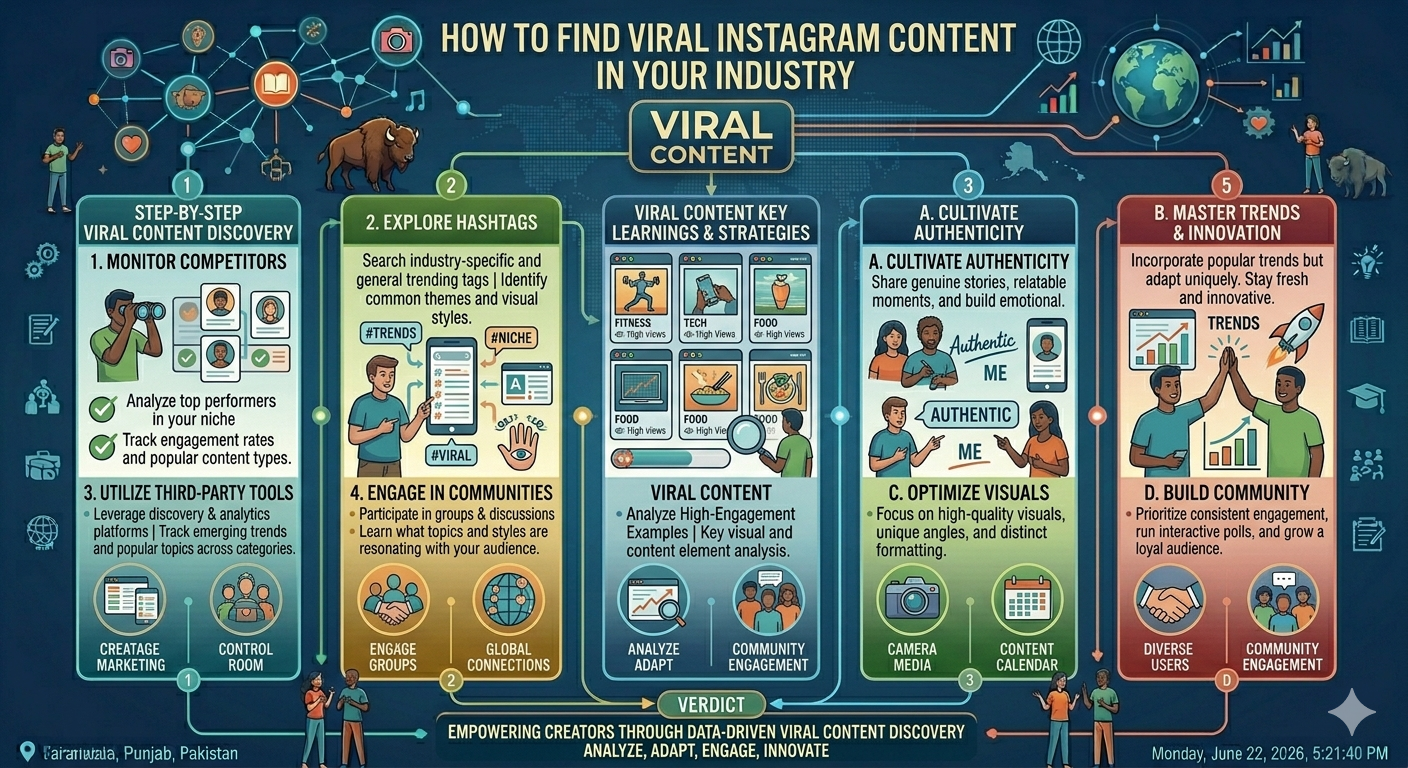
How to Find Viral Instagram Content in Your Industry
-
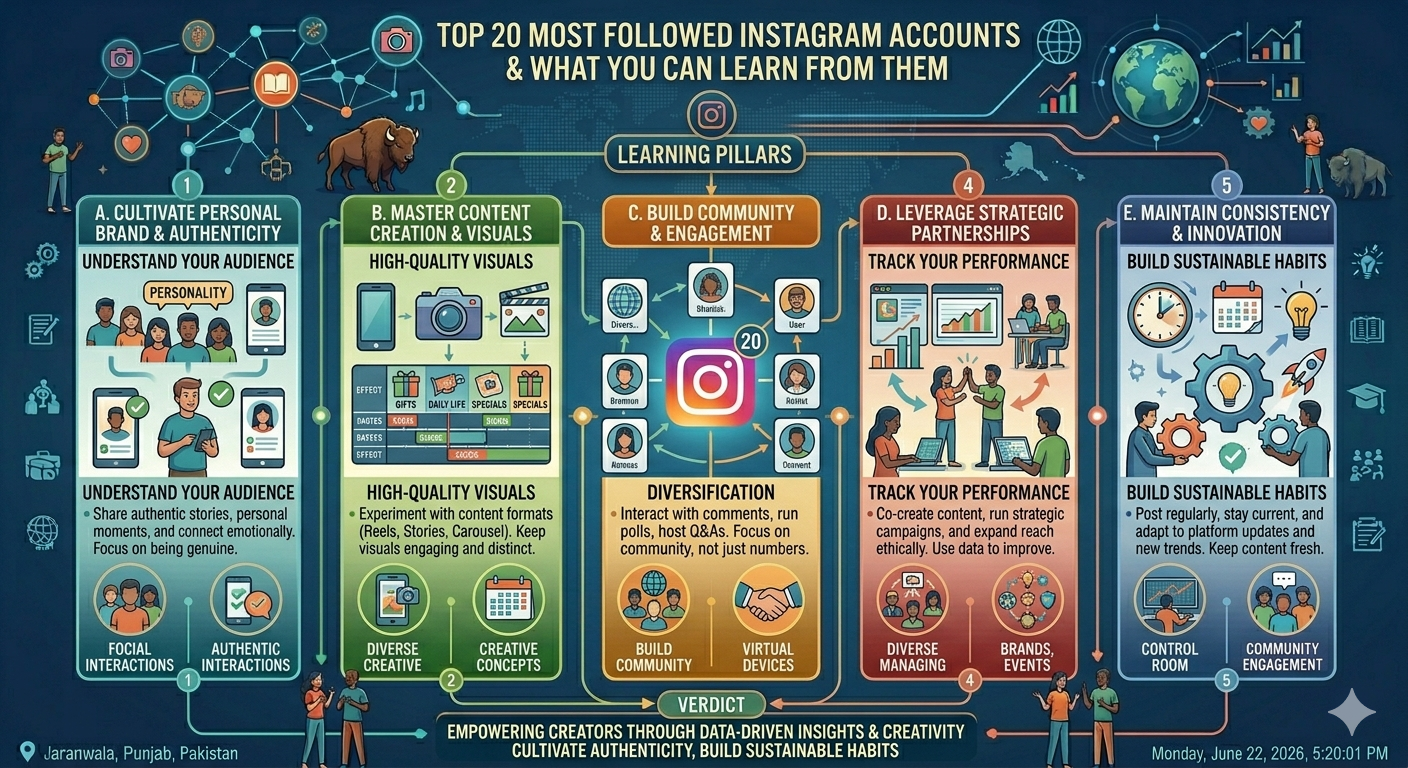
Top 20 Most Followed Instagram Accounts and What You Can Learn From Them
Conclusion
Using Instagram analytics for content planning transforms a reactive, intuition based content process into a systematic, evidence based one. The ten step process in this guide, from auditing recent performance through building a calendar to reviewing results at cycle end, creates a continuous improvement loop where each content period is better informed than the last.
The investment in this process is modest. A few hours per month of structured analytics review and planning produces significantly better results over time than spending the same time creating content without any analytical foundation.
Access analytics data for your niche research and competitive planning on InstaPV →