Introduction
Analytics intimidates a lot of creators. The combination of unfamiliar terminology, multiple dashboards showing overlapping numbers, and the implied complexity of data interpretation creates a barrier that many creative people prefer to avoid entirely rather than engage with imperfectly.
This avoidance is understandable but costly. Creators who engage with analytics, even imperfectly, consistently make better content decisions than those who rely on intuition alone. They discover what their audience actually responds to rather than what they assumed the audience would respond to. They identify growth bottlenecks before they become entrenched. They build strategies that improve over time rather than repeating the same approaches indefinitely.
This guide is specifically for creators who have found analytics confusing or off-putting. It covers what actually matters, what you can safely ignore, how to build a simple analytics practice that takes thirty minutes per month, and how to translate the numbers you find into decisions about what to create next.Instapv
The Three Numbers Every Creator Must Understand
Before anything else, three fundamental analytics concepts underlie every other insight available from Instagram data. Understanding these three things provides the majority of the analytical value available from any creator analytics practice.
Number 1: Engagement Rate
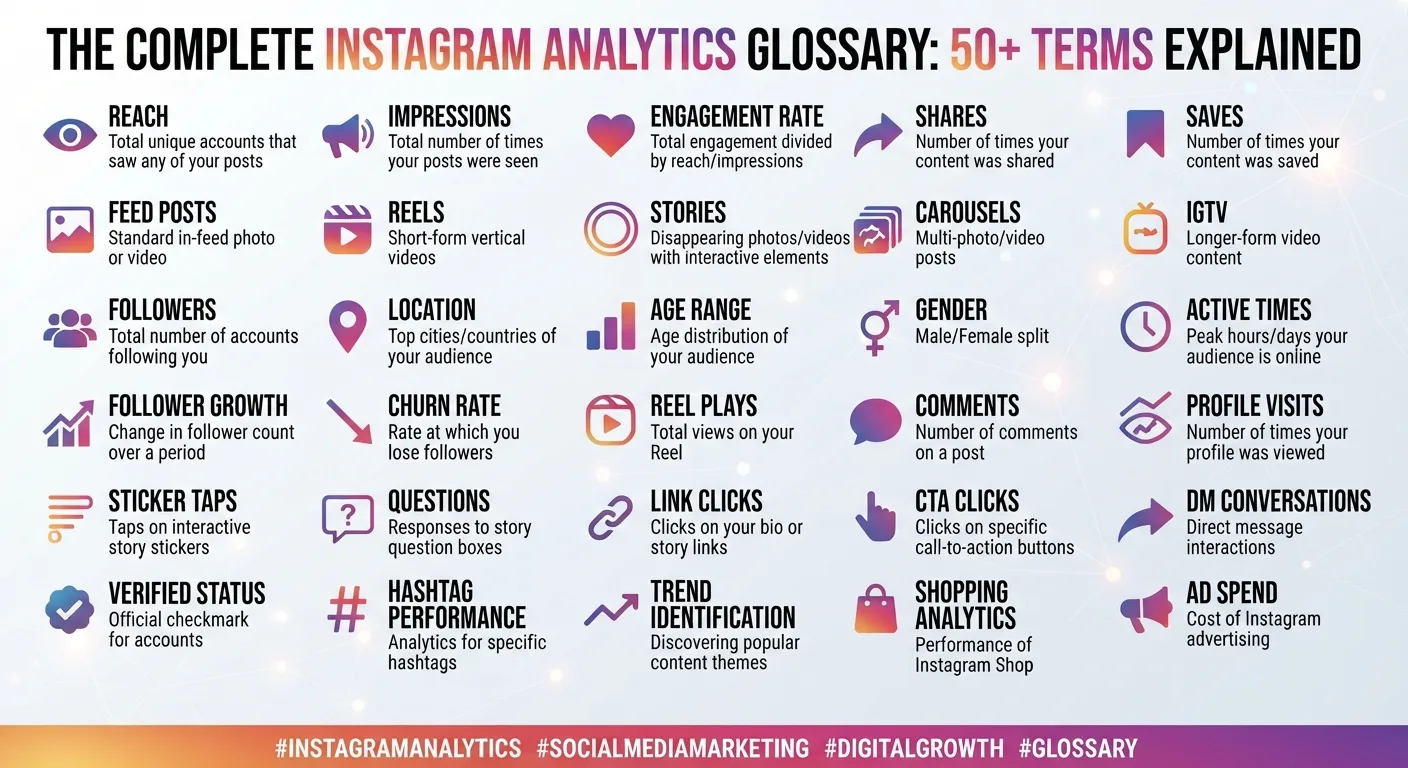
As covered in Day 2's analytics guide and Day 8's engagement rate guide, engagement rate is the percentage of your audience that actively responds to your content. It is calculated by dividing total engagements by total followers and multiplying by 100.Read blog
Why it matters more than everything else: Engagement rate tells you whether your audience genuinely cares about your content or simply exists as passive numbers. An account with 100,000 followers and 0.5 percent engagement has an audience that barely notices what is posted. An account with 10,000 followers and 7 percent engagement has an audience that is genuinely invested.
For creators specifically, engagement rate is the single metric that brands look at first when evaluating partnership value. As covered in Day 8, an engagement rate significantly above the benchmark for your account size tier, which varies from around 4 to 8 percent for accounts under 10,000 followers down to around 1 to 2 percent for accounts above 500,000 followers, is the primary driver of your commercial value as a creator regardless of follower count.
What to do with this number: Check your average engagement rate across the last twenty posts monthly. If it is trending upward, your content is improving in relevance to your audience. If it is trending downward, something has changed that needs investigating.
Number 2: Save Rate
Save rate is the percentage of viewers who save a specific post. As covered throughout this series, saves are one of the most important signals Instagram's algorithm uses to decide how widely to distribute content.
Why it matters: Saves indicate that people found your content genuinely useful or reference-worthy rather than just entertaining in the moment. Content that generates saves performs better algorithmically over time because Instagram distributes it to broader audiences. Educational, how-to, list, and reference content typically generates the highest save rates.
What to do with this number: Review your most recent fifteen posts and identify which two or three have the highest visible save activity or, if you have Instagram Insights access, the highest save count. Look for patterns in what these posts have in common. More of those patterns means higher save rates.
Number 3: Non-Follower Reach Percentage
For Reels specifically, the percentage of total reach coming from non-followers, available through Instagram Insights, measures whether your content is reaching new audiences beyond your existing followers.
Why it matters: As covered in Day 22's reach guide and Day 11's Reels strategy guide, reaching people who do not already follow you is the primary mechanism of audience growth. A Reel that reaches 95 percent existing followers is serving your existing audience but not growing it. A Reel where 60 percent of reach comes from non-followers through the Reels tab and Explore page is actively bringing new people into your account.
What to do with this number: Check this for each Reel you publish. If your Reels are consistently showing under 20 percent non-follower reach, the content is not being distributed widely to new audiences, which means the hook, content quality, or format needs review.
The Analytics You Can Safely Ignore (For Now)
One of the most useful things about analytics education is learning what not to track, not just what to track. Several metrics that get a lot of attention in Instagram discussions are worth largely ignoring for creators who are building their first analytics practice.
Total Impressions
As covered in Day 5's reach versus impressions guide, impressions count every view including repeat views from the same person. The number is always higher than reach and always sounds more impressive. But for most creative decisions, reach, which counts unique viewers, is more useful because it tells you how many different people saw your content. Total impressions can distract from the more meaningful reach figures without adding equivalent analytical value.
Total Follower Count as a Weekly Focus
Your follower count matters as a milestone metric and as a context for interpreting engagement rate. It does not need to be checked weekly. Watching follower count too frequently creates unnecessary anxiety about normal short-term fluctuations and encourages follower count optimization at the expense of engagement quality. Monthly tracking is entirely sufficient.
Individual Post Like Counts in Isolation
Likes are the least meaningful of the major engagement signals as covered in Day 2's analytics guide. A post with many likes but few comments and saves is performing less well than a post with fewer likes but substantial comments and saves. Looking at like counts in isolation, without context from other engagement signals, consistently produces misleading conclusions about what content is actually performing well.
Building a Thirty-Minute Monthly Analytics Practice
The barrier to analytics engagement for most creators is not understanding. It is habit. A simple, time-bounded monthly practice is far more valuable than an elaborate analytical framework that never gets used because it feels overwhelming.
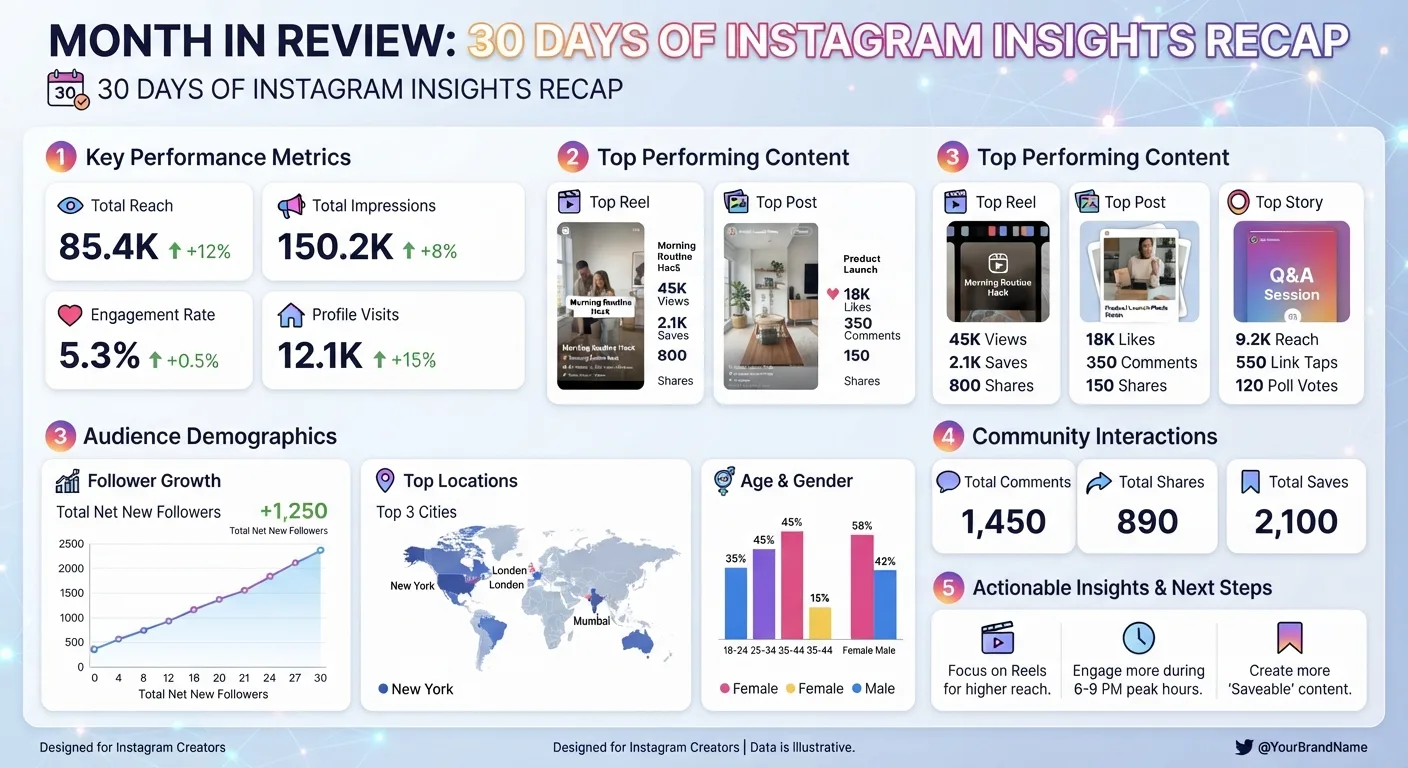
This specific thirty-minute practice covers everything a creator needs to be making informed content decisions.
Minutes 1 to 10: Review Your Last Twenty Posts
Open Instagram Insights and pull up your last twenty posts. Sort them or scan them for the highest and lowest performing posts by engagement rate.
Write down the two or three top performers and the two or three bottom performers. For each, note the content type (Reel, carousel, single image, video), the content topic or theme, and approximately what the post was about.
Do not yet try to interpret why any post performed as it did. Just document the data.
Minutes 11 to 20: Find the Pattern
Look at the six posts you documented (three top, three bottom) and ask two questions.
What do my top performers have in common? Are they a specific format? A specific topic? A specific structural approach like lists or before-and-after? Do they share a tone or a visual style?
What do my bottom performers have in common? Are they a format that consistently underperforms for your account? A topic that your audience is less interested in than you assumed? A structural approach that is not resonating?
Write down one to two specific patterns you notice. These patterns are the most valuable output of the entire analytics session.
Minutes 21 to 25: Check Your Competitive Benchmark
Open InstaPV and search two to three accounts that are the most relevant comparisons for your account, whether direct competitors or comparable accounts in your niche at a similar follower size.
Note their approximate engagement rate and whether their follower growth is accelerating, stable, or declining. This takes about ninety seconds per account.
The purpose is simple context: are you performing above, at, or below what comparable accounts in your niche are achieving? This answers whether your engagement rate is genuinely strong or just decent relative to competition.
Minutes 26 to 30: Make Three Specific Decisions
Based on the pattern you identified and the competitive context, write down three specific content decisions for the next month.
Examples of specific decisions: next month I will produce two carousels on topics similar to my two highest-performing posts from this month. Next month I will stop posting single-image posts, which have consistently underperformed across the last three months, and replace them with additional Reels. Next month I will specifically experiment with the question-based caption format from Day 12's caption guide on my educational content, since that format seems to be working well for comparable accounts.
Three specific decisions, grounded in data, each targeting something you will do more of, less of, or differently next month.
That is the complete practice. Thirty minutes. Monthly. Consistently applied over six months, it produces dramatically better content decision-making than any amount of intuition without feedback.
The Creator Mindset Shift That Makes Analytics Useful
Beyond the mechanical practice of tracking and reviewing numbers, the most important shift creators can make in their relationship with analytics is treating content as experiments rather than as creative expressions that are simply evaluated after the fact.
The experimental mindset asks a specific question before every piece of content: what do I expect this content to achieve, and why? Not in terms of specific numbers necessarily, but in terms of which mechanism it is intended to activate. This Reel is intended to generate non-follower discovery through a strong hook and shareable insight. This carousel is intended to generate high saves through reference-worthy educational content. This Story sequence is intended to deepen relationship through personal narrative and a specific community question.
When you know what a piece of content is designed to do before you publish it, you can evaluate whether it did that thing after it is published. Content that succeeded at its intended mechanism provides evidence for making more similar content. Content that failed at its intended mechanism provides evidence for understanding what specifically did not work.
This experimental framing does not require eliminating creative intuition. It requires adding a layer of intentionality about mechanism alongside the creative decisions about what to make. The best creators combine both: genuine creative investment in making interesting, meaningful content alongside analytical awareness of how different content types drive different outcomes.
Common Creator Analytics Mistakes and How to Avoid Them
Comparing Incomparable Content Types
Comparing a Reel's reach against a carousel's reach, or a Story's view count against a feed post's engagement rate, produces meaningless comparisons. Different formats serve different purposes and perform through different mechanisms. As covered in Day 12's format comparison guide, each format should be evaluated against the specific outcomes it was designed to produce, not against all other formats on a single universal metric.
Drawing Conclusions From Too Little Data
A single post that performs unusually well or unusually poorly is a data point, not a trend. As covered throughout this series, particularly in Day 23's analytics-to-action guide, reliable patterns require at least ten to fifteen data points before being trustworthy enough to base strategy decisions on. Changing strategy after one viral post or one low-performing post introduces noise into the strategy that typically makes things worse.
Ignoring Qualitative Signals
Numbers alone do not tell the complete story. The quality of comments, as covered in Day 11's fake account guide and Day 12's caption guide, reveals whether the audience is genuinely engaged with the content or providing low-effort generic responses. Two posts with identical engagement rates but very different comment quality represent very different actual performance. Qualitative assessment of comment quality belongs alongside quantitative metrics in any complete content review.
Optimizing for Metrics Instead of Outcomes
As covered in Day 18's business metrics guide and Day 27's success metrics guide, there is a persistent risk of optimizing for platform metrics rather than for the business or creative outcomes that actually matter. An engagement rate that keeps improving while client inquiries remain flat, or while creative satisfaction declines as content becomes increasingly formulaic, represents metric optimization at the expense of genuine purpose. Keeping the connection between platform metrics and actual goals visible prevents this drift.
How InstaPV Supports Creator Analytics
Throughout this series, InstaPV has appeared repeatedly as the primary tool for research and competitive benchmarking in creator analytics practice.
For creators specifically, the most valuable use of InstaPV is the competitive benchmark check that takes five to ten minutes during the monthly review. Searching two to three comparable accounts and reviewing their engagement rate and follower growth trajectory provides the context that makes your own metrics interpretable.
Without this external context, your engagement rate is just a number. With it, you know whether you are outperforming, matching, or underperforming the relevant standard for your specific situation. That context is often the difference between correctly identifying a genuine strategy problem and incorrectly interpreting normal performance as a failure.
InstaPV also supports content research when you want to understand what is working in your niche before planning next month's content. Reviewing the Stories and Highlights of top-performing accounts anonymously, as covered in Day 7's influencer research walkthrough, reveals what content approaches are generating strong engagement with your shared target audience without requiring you to follow or interact with these accounts through your main Instagram account.
Frequently Asked Questions
Q: How long before analytics start showing meaningful patterns?
Three to four months of consistent posting with monthly analytics reviews typically produces enough data for reliable pattern identification. The first month's data is too small a sample to be reliable. By months three and four, patterns across fifteen to twenty posts begin to consistently point in clear directions about what is working and what is not.
Q: Do I need a business or creator account to do meaningful analytics?
For the most important metrics including save counts, reach data, and non-follower reach percentage, a business or creator account with Instagram Insights is needed. As covered in Day 16's Instagram Insights guide, switching to a creator account is free and gives access to the analytics infrastructure this practice requires. For creators posting seriously, switching is strongly recommended.
Q: Is there a shortcut for identifying save-worthy content before publishing?
The most reliable predictor of high save rate is whether the content provides specific, actionable reference value that viewers would want to return to. Before publishing, asking whether a viewer would save this for future reference when they need the information or inspiration produces a useful pre-publication save rate prediction. Content that you would honestly save yourself is content that your audience will save at higher rates than content you would scroll past.
Q: What if my analytics consistently show strong numbers but I am not growing?
Strong engagement rate with minimal growth typically indicates the content is resonating deeply with existing followers but is not being discovered by new audiences. This points to a Reels strategy gap: content that performs well with existing followers often has lower non-follower reach because it is calibrated to the specific shared context of the existing community rather than to the immediate intelligibility that cold-audience discovery requires. As covered in Day 11's Reels strategy guide, the specific optimization for cold-audience discovery centers on hook accessibility and immediate value clarity for viewers with no prior context about the account.
-
How to Grow to 10K Instagram Followers in 90 Days (Realistic Plan)
-
Instagram Trends to Watch in Q3 2026
-
How to Use Instagram Analytics for Affiliate Marketing Success
Conclusion
Analytics for creators does not need to be complicated. Three core metrics, engagement rate, save rate, and non-follower Reel reach percentage, cover the vast majority of insights that translate into better content decisions. A thirty-minute monthly practice that reviews recent posts, identifies performance patterns, checks competitive benchmarks through InstaPV, and produces three specific content decisions provides the analytical foundation that distinguishes creators who improve systematically from those who plateau.
The shift from treating content as creative expression to treating it as experiments with hypotheses and measurable outcomes is the fundamental mindset change that makes analytics genuinely useful rather than just a number-watching exercise. Combined with the consistent creative investment that makes the content worth watching in the first place, this analytical mindset produces the compounding improvement over time that is the real competitive advantage of creators who engage seriously with their data.
Start benchmarking your performance against creators in your niche on InstaPV →