Introduction
Instagram analytics comes with a vocabulary that ranges from intuitive to opaque. Some terms are self-explanatory. Others are used inconsistently across different tools and platforms in ways that create confusion. And some terms that sound similar, like reach and impressions, or engagement rate by follower versus engagement rate by reach, describe meaningfully different things that get conflated in casual conversation with real consequences for how performance is interpreted.
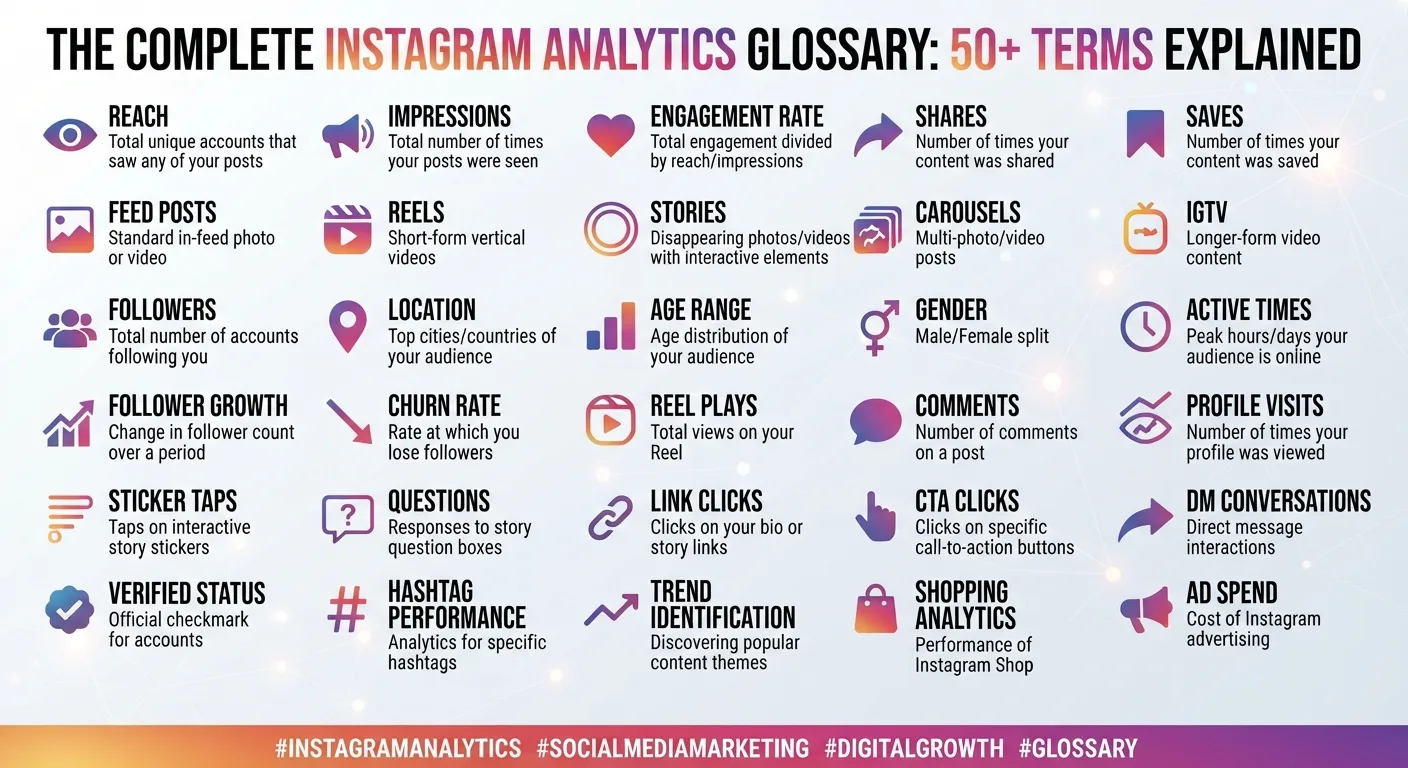
This glossary covers the full vocabulary of Instagram analytics in plain language, organized to be useful both as a reference document for looking up specific terms and as a sequential read for anyone building foundational analytics literacy. Terms are grouped by category rather than alphabetically to show the relationships between related concepts.Instapv
Audience and Follower Terms
Followers: The total number of Instagram accounts that have chosen to follow a specific account. Each follower has opted in to see the account's content in their feed. As covered in Day 2's analytics guide, follower count is a widely tracked but often overweighted metric because it measures the size of the potential audience without measuring their engagement quality.
Following: The number of accounts that a specific account follows. The ratio between following and followers provides a signal about how an account built its audience, as covered in Day 11's fake account detection guide.
Net Follower Growth: The difference between followers gained and followers lost during a specific period. A more meaningful growth metric than gross new followers because it accounts for the churn that naturally occurs in any account's following.
Follower Growth Rate: Net follower growth expressed as a percentage of the starting follower count for a period. Used for comparing growth pace across accounts of different sizes. As covered in Day 5's follower growth guide, growth rate is more analytically useful than absolute growth numbers for comparative purposes.
Follower Churn: The number of followers who unfollow an account during a specific period. High churn alongside modest net growth indicates that many new followers are being acquired while many existing ones are leaving, which often signals content inconsistency or audience misalignment.Read blog
Audience Demographics: The breakdown of an account's followers by age range, gender, and geographic location. Available through Instagram Insights for business and creator accounts. As covered in Day 11's demographics guide, demographic data is most useful when compared against the intended target audience profile.
Active Hours: The times and days when an account's followers are most active on Instagram. Available through Instagram Insights and most directly useful for optimizing posting schedule, as covered in Day 5's posting time guide.
Follower Quality: An informal assessment of whether an account's followers are genuine, active human beings likely to engage with content. As covered in Day 18's fake follower guide, follower quality is indicated by engagement rate relative to follower count, growth pattern analysis, and comment quality assessment.
Nano-Influencer: An account with fewer than 10,000 followers. Often characterized by the highest engagement rates of any follower tier due to the close, personal relationship with a small, highly self-selected audience.
Micro-Influencer: An account with approximately 10,000 to 100,000 followers. As covered in Day 8's micro-influencer guide, micro-influencers frequently offer the strongest ROI for brand partnerships due to their combination of meaningful reach and above-average engagement rates.
Mid-Tier Influencer: An account with approximately 100,000 to 500,000 followers. Typically shows lower engagement rates than micro-influencers but higher absolute engagement volumes and access to broader audiences.
Macro-Influencer: An account with approximately 500,000 to 1,000,000 followers. Characterized by significant reach but typically lower engagement rates due to the passive follower proportion that accumulates at large audience sizes.
Mega-Influencer: An account with over 1,000,000 followers. Often includes celebrities and well-known public figures. Typically characterized by the lowest engagement rates but the highest absolute reach.
Reach and Visibility Terms
Reach: The number of unique accounts that saw a specific piece of content during a measurement period. Each account is counted once regardless of how many times they viewed the content. As covered in Day 5's reach versus impressions guide and Day 22's reach guide, reach is the primary metric for measuring genuine audience exposure to content.
Impressions: The total number of times a piece of content was displayed, including multiple views from the same account. Always greater than or equal to reach for the same content and period. As covered in Day 5's reach versus impressions guide, impressions measure total exposure volume while reach measures unique audience exposure.
Reach Rate: Reach expressed as a percentage of total followers. Useful for comparing reach performance across different account sizes or across the same account over time. A high reach rate indicates the algorithm is distributing content to a large proportion of the follower base.
Non-Follower Reach: The portion of total reach that comes from accounts who do not follow the account, reached through Explore, the Reels tab, hashtag pages, or shares. As covered in Day 22's reach guide and Day 15's Reels analytics guide, non-follower reach is the primary mechanism of organic audience growth.
Reach by Source: The breakdown of total reach by where viewers discovered the content: home feed, Explore page, Reels tab, hashtag pages, profile visits, or shares. Available through Instagram Insights and one of the most strategically valuable data points for understanding which distribution channels are working for specific content.
Explore Reach: The portion of reach coming from the Explore page. Indicates the algorithm is distributing content to non-followers based on interest matching, as covered in Day 7's algorithm guide.
Hashtag Reach: The portion of reach coming from hashtag page discovery. As covered in Day 22's hashtag tracking guide, this metric is the primary indicator of whether hashtag strategy is generating meaningful additional discovery beyond algorithmic distribution.
Story Views: The count of unique accounts that opened a Story and saw at least the first frame. As covered in Day 16's Story views guide, raw view count is less informative than completion rate for assessing Story performance.
Engagement Terms
Engagement: Any active interaction by a viewer with content. Includes likes, comments, saves, and shares for feed posts, and views, replies, poll responses, and link taps for Stories.
Like: The most basic form of content engagement, requiring minimal effort from the viewer. Weighted less heavily than other engagement types by the algorithm due to its low friction nature.
Comment: A text response left on a post. Requires meaningfully more effort than a like and is therefore weighted more heavily by the algorithm. Comment quality, meaning whether comments are substantive and content-specific, provides additional insight beyond comment count, as covered in Day 12's caption guide and Day 11's fake account guide.
Save: When a viewer bookmarks a post to their saved collection for future reference. As covered in Day 16's content types guide and throughout this series, saves are one of the strongest algorithmic signals because they indicate the viewer found the content genuinely valuable enough to keep. High save rates are strongly associated with educational, reference-worthy, and genuinely useful content.
Share: When a viewer sends content to another account via direct message or reposts it to their own Story. As covered in Day 17's viral Stories guide and Day 10's viral content guide, shares are one of the strongest engagement signals because they require the viewer to actively decide that someone specific in their network should see the content.
Story Reply: A direct message sent in response to a Story. Represents one of the deepest available engagement signals since it requires initiating a private conversation, which indicates genuine emotional or intellectual response to the content.
Interactive Element Response: A viewer interaction with a Stories interactive sticker, including poll votes, quiz answers, question submissions, and slider reactions. As covered in Day 8's Stories best practices guide, interactive element responses are strong community engagement signals that influence Stories bar algorithmic placement.
Link Tap: When a viewer taps a Story link sticker or other clickable link element. As covered in Day 19's Story links guide, link taps are the most direct available measure of Instagram content driving off-platform action.
Story Exit: When a viewer leaves a Story sequence before reaching the final frame, either by exiting the app or returning to the Stories bar. High exit rates at specific frames identify the moments where Story content is losing viewer attention, as covered in Day 25's completion rate guide.
Engagement Rate Terms
Engagement Rate: The percentage of an account's audience that actively engages with content. The standard formula is total engagements divided by total followers multiplied by 100, as covered in Day 8's engagement rate guide. The single most important metric for assessing content-audience relationship quality.
Engagement Rate by Reach: An alternative engagement rate formula using reach in the denominator instead of followers: total engagements divided by reach multiplied by 100. Measures what percentage of people who actually saw the content engaged with it, as covered in Day 5's reach versus impressions guide.
Average Engagement Rate: Engagement rate calculated across multiple posts over a period, typically the last ten to twenty posts, to produce a more reliable performance indicator than any single post's rate. As covered in Day 8's engagement rate guide, average engagement rate smooths out the natural variation between individual posts.
Benchmark Engagement Rate: The typical engagement rate expected for an account of a specific size in a specific niche. Used for comparing an account's performance against what comparable accounts achieve. As covered in Day 8 and throughout this series, benchmarks vary significantly by account size tier.
Save Rate: Saves expressed as a percentage of reach, measuring what proportion of viewers who saw content found it reference-worthy enough to save. One of the most actionable engagement metrics as covered throughout this series.
Share Rate: Shares expressed as a percentage of reach. Shares are the engagement signal most directly associated with content virality and word-of-mouth distribution.
Reels-Specific Terms
Watch Time: The total amount of time viewers spent watching a Reel. One of the primary algorithmic signals for Reels distribution, as covered in Day 11's Reels strategy guide and Day 15's Reels analytics guide.
Completion Rate: The percentage of viewers who watched a Reel from beginning to end. Along with watch time, one of the most important Reels performance metrics because it most directly reflects whether the content held viewer attention throughout, as covered in Day 25's completion rate guide.
Average Watch Time: The average duration viewers watched before exiting. Combined with total Reel length, reveals approximately where in the content viewers are dropping off.
Replay Rate: The percentage of viewers who watched a Reel more than once. A high replay rate is a strong positive quality signal indicating content compelling enough to warrant rewatching, as covered in Day 11's Reels strategy guide.
Reels Tab Reach: The portion of Reel reach coming from the Reels tab, where Instagram distributes content specifically to non-followers based on interest signals. The most direct indicator of whether a Reel is functioning as a discovery mechanism, as covered in Day 15's Reels analytics guide.
Hook: The first three seconds of a Reel, which determine whether viewers continue watching or scroll away. As covered in Day 11's Reels strategy guide, the hook is the most critical creative element in any Reel for algorithmic performance.
Story-Specific Terms
Story Completion Rate: The percentage of viewers who started a Story sequence and watched through to the final frame. As covered in Day 25's completion rate guide, completion rate is the most important Story performance metric for assessing whether content is holding viewer attention.
Story Reach: The number of unique accounts that opened a Story and saw at least the first frame. As covered in Day 16's Story views guide, reach is distinct from completion and provides less information about content quality in isolation.
Forward Tap: When a viewer taps the right side of a Story frame to advance to the next frame. A neutral signal indicating normal Story navigation.
Back Tap: When a viewer taps the left side of a Story frame to replay the current frame or return to the previous one. A positive signal indicating the viewer found the frame compelling enough to rewatch.
Story Exit Rate: The percentage of viewers who leave a Story sequence at a specific frame before reaching the end. High exit rates at specific frames identify the weak points in Story content where viewer attention is being lost, as covered in Day 16's Story views guide.
Business and Conversion Terms
Website Clicks: The number of clicks on the website link in the bio or on any linked element within content. A direct measure of Instagram's ability to drive traffic to external destinations.
Link Click Rate: Website clicks expressed as a percentage of profile visits. Measures how effectively the profile and its call to action are converting profile visitors into website visitors, as covered in Day 18's business metrics guide.
Profile Visits: The number of times the account's profile page was viewed during a measurement period. A high profile visit count from specific content indicates that content is generating sufficient interest for viewers to investigate the account further.
Conversion Rate: The percentage of Instagram-sourced website visitors who complete a desired action such as a purchase, form submission, or sign-up. Available through website analytics with proper UTM parameter setup as covered in Day 26's ROI measurement guide.
Instagram ROI: The return on investment from Instagram, calculated by comparing the business value generated by Instagram activity against the cost of producing and maintaining that activity. As covered in Day 26's ROI guide, meaningful ROI measurement requires connecting Instagram metrics to downstream business outcomes rather than only tracking platform metrics.
UTM Parameters: Tags added to URLs that allow website analytics platforms to identify exactly which Instagram activity drove specific website traffic. The technical foundation of Instagram traffic and conversion attribution, as covered in Day 18's business metrics guide and Day 26's ROI guide.
Algorithm and Distribution Terms
Algorithmic Distribution: The process by which Instagram's ranking systems determine which content to show to which users at what time, based on predicted engagement probability. As covered in Day 7's algorithm guide and Day 20's algorithm science post, Instagram uses multiple distinct ranking systems for different platform surfaces.
Feed Ranking Signals: The factors Instagram's main feed algorithm uses to determine content placement in followers' feeds, including relationship strength, interest prediction, content type, recency, and early engagement velocity.
Engagement Velocity: The rate at which a piece of content accumulates engagement signals in the period immediately after publishing. As covered in Day 20's algorithm science post, strong early engagement velocity is one of the most important signals triggering broader algorithmic distribution.
Relationship Signal: The algorithmic indicator of how strong the connection is between two accounts, inferred from their history of interaction. Strong relationship signals improve content placement in followers' feeds.
Recommender Eligibility: Whether a Reel meets Instagram's criteria for distribution to non-followers through the Reels tab and Explore page. As covered in Day 11's Reels strategy guide, content with watermarks from other platforms may not be eligible for recommendation.
Shadowban: A widely circulated but largely mythological concept suggesting Instagram secretly suppresses specific accounts or content without notification. As covered in Day 7's algorithm guide, Instagram has denied having such a system, and most described shadowban experiences reflect normal algorithmic distribution based on engagement signals and content policy filtering.
Competitive Research Terms
Competitive Benchmark: A performance reference point derived from comparable accounts in the same niche and size tier. Used to determine whether an account's metrics represent strong, average, or below-average performance for its specific situation, as covered in Day 9's competitor analysis guide.
Follower Growth Spike: A sharp, sudden increase in follower count over a short period. Organic growth spikes correspond to viral content, press coverage, or significant collaborations. Unexplained spikes may indicate purchased followers, as covered in Day 18's fake follower guide.
Engagement Rate Comparison: The practice of comparing an account's engagement rate against comparable accounts in the same niche and size tier to contextualize whether the metric represents strong or weak performance relative to competitive standards.
Reporting and Analysis Terms
KPI (Key Performance Indicator): A specific, measurable metric selected as the primary indicator of progress toward a defined strategic objective. As covered in Day 19's KPI guide, effective KPIs are directly connected to business goals rather than selected because they are available or conventionally tracked.
Vanity Metric: A metric that looks impressive but has weak or no connection to actual business outcomes. As covered in Day 18's business metrics guide, follower count and total likes count are the primary vanity metrics in Instagram analytics.
Baseline: The current performance level on a metric at the start of a measurement or strategy period. Used as the reference point against which targets are set and future performance is evaluated.
Trend: The directional change in a metric over a series of measurement periods. Identifying whether a metric is improving, stable, or declining is often more important than the absolute value at any single point.
Cohort Analysis: Analyzing the behavior of a specific group of followers acquired during a particular period to understand how different follower cohorts engage compared to each other. Useful for understanding the quality of followers acquired through different growth activities.
Attribution: The practice of connecting Instagram activity to specific business outcomes by identifying which Instagram content or actions were responsible for driving specific website visits, leads, or revenue. As covered in Day 26's ROI guide, proper attribution requires technical setup including UTM parameters and goal tracking in website analytics platforms.
Frequently Asked Questions
Q: Which terms in this glossary are most important for someone just starting to learn Instagram analytics?
The foundation terms to master first are reach, impressions, engagement rate, save rate, and follower growth rate. These five concepts, clearly understood and correctly interpreted, provide the basis for most meaningful Instagram performance assessment. Understanding the difference between reach and impressions, and why engagement rate matters more than follower count, produces the most significant initial shift in analytical sophistication.
Q: Why do some analytics terms have different definitions across different tools?
Different tools use different formulas for the same metric names and different definitions for the same underlying concepts. Engagement rate is particularly inconsistent across tools, with some including only likes and comments, others including saves and shares, and others using reach rather than followers in the denominator. Always verify what specific formula a tool uses for any metric before comparing its output against benchmarks from other sources.
Q: Are all these terms applicable to every Instagram account?
Some terms apply universally, while others are relevant only to specific account types. Story-specific terms apply only to accounts that actively use Stories. Reels-specific terms apply only to accounts producing Reels. Business conversion terms apply most directly to accounts with measurable business objectives connected to Instagram activity. Build your working vocabulary from the terms most relevant to your specific account situation rather than trying to track every term simultaneously.
-
Top Instagram Tools for Social Media Agencies (2026 Edition)
-
Instagram Success Metrics: How to Know If Your Strategy Is Working
-
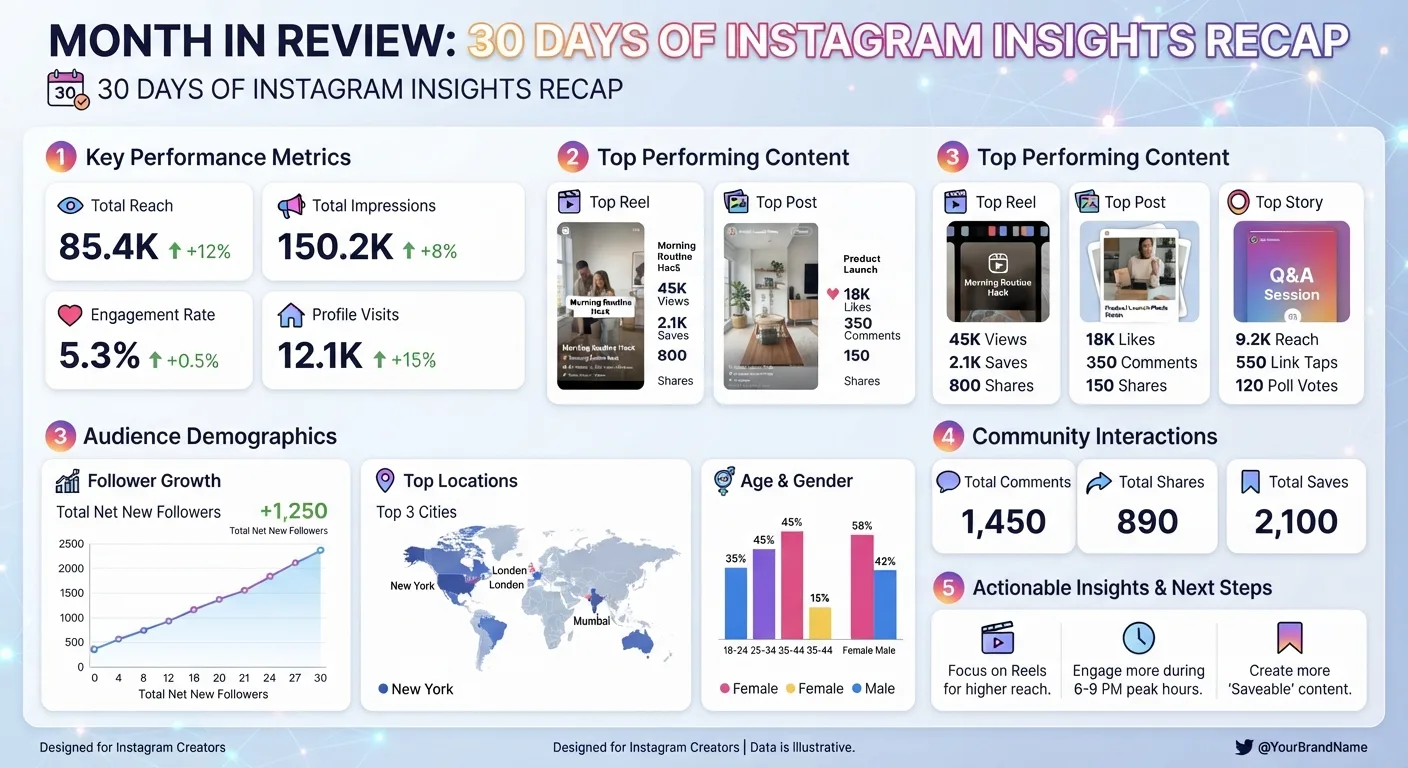
Month in Review: 30 Days of Instagram Insights Recap
Conclusion
Instagram analytics vocabulary is extensive but navigable once the underlying concepts and their relationships to each other are understood. The most important foundational distinctions, between reach and impressions, between engagement rate and follower count, between save rate and like rate, between vanity metrics and business impact metrics, produce the biggest improvements in how performance is interpreted and how strategy decisions are informed.
This glossary is designed as a living reference document. As Instagram's platform evolves and new features and metrics become available, the vocabulary expands accordingly. The core analytical concepts, however, remain stable: genuine audience relationship, content quality that earns engagement, and the downstream business outcomes that justify the investment in Instagram strategy.
Apply these analytics concepts to competitive research for any public account on InstaPV →