Introduction
Affiliate marketing on Instagram has matured significantly from its early days of simple link-in-bio referrals. In 2026, successful Instagram affiliate marketers operate with a level of analytical sophistication that distinguishes genuinely profitable programs from the vast majority of affiliate activity that generates minimal income despite significant content investment.
The difference between an affiliate marketer who earns meaningful income from Instagram and one who posts affiliate links consistently without results is almost never talent or content quality alone. It is the presence or absence of an analytical framework that identifies what is actually working, why it is working, and how to do more of it. Without analytics, affiliate marketing is guesswork. With analytics, it is an optimizable system.
This guide covers how to build and use that analytical framework, from setting up proper tracking through analyzing what content drives affiliate conversion to optimizing posting strategy based on evidence rather than intuition.Instapv
Understanding the Affiliate Marketing Funnel on Instagram
Before getting into analytics, understanding the specific funnel through which Instagram affiliate conversions happen clarifies which analytics matter at which stage.
Stage 1: Discovery
The first stage is reaching potential buyers who are not yet aware of the product or the affiliate relationship. On Instagram, discovery happens primarily through Reels reaching non-followers through the Reels tab and Explore page, as covered in Day 11's Reels strategy guide and Day 22's reach guide. The analytics relevant to discovery are non-follower reach percentage and total reach volume for content featuring affiliate products.Read blog
Stage 2: Consideration
The second stage is moving interested viewers from awareness of a product to serious consideration of purchasing. This happens through content that demonstrates genuine product value, answers purchase objections, and builds trust in the recommendation. The analytics relevant to consideration are save rate, which indicates viewers are keeping the recommendation for reference, and comment quality, which reveals the depth of genuine interest.
Stage 3: Conversion
The third stage is the actual click through to the affiliate link and the subsequent purchase. This is where the direct revenue measurement happens. The analytics relevant to conversion are link tap rate from Stories, bio link click rate, and the downstream conversion rate and revenue from the affiliate tracking system.
Setting Up Affiliate Analytics Infrastructure
Proper analytics infrastructure is the prerequisite for any meaningful affiliate performance measurement. Without it, the only data available is the affiliate network's reported conversions, which tells you what sold but not what Instagram content drove the sale or how to reproduce the result.
Affiliate Link Tracking
Most affiliate programs provide tracking links that record clicks and attribute conversions. These links should be the only links used in any Instagram content featuring affiliate products, never raw product URLs that are untracked.
For Instagram specifically, tracking links can be placed in the bio link using a link-in-bio tool as covered in Day 13's creator tools guide, in Story link stickers as covered in Day 19's Story links guide, and in direct message responses to followers asking about specific products.
UTM Parameter Integration
Where affiliate programs allow customization of tracking links, adding UTM parameters to affiliate links enables tracking not just whether a conversion happened but which specific Instagram content drove it.
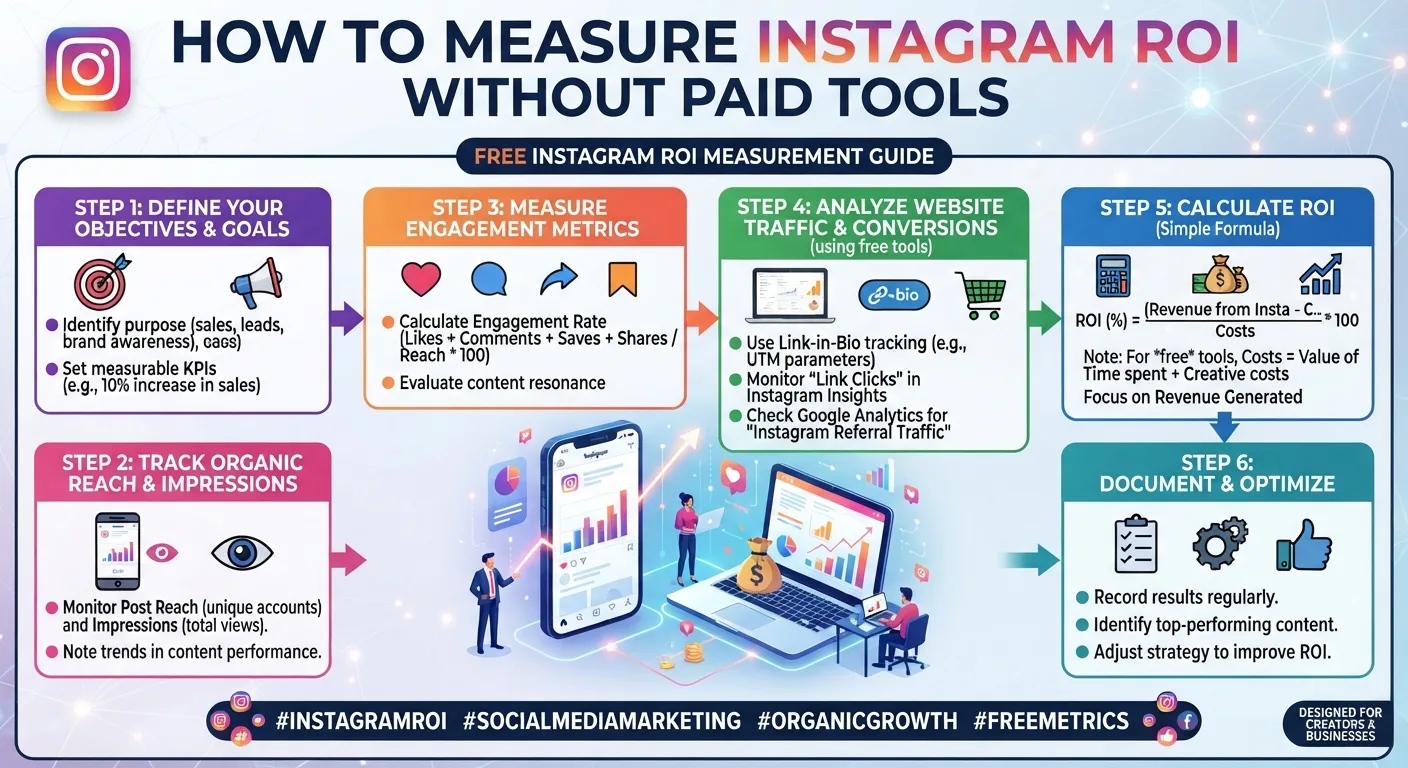
As covered in Day 26's ROI measurement guide, UTM parameters allow website analytics to identify traffic source, medium, and campaign. For affiliate content, setting utm_source as instagram and utm_medium to indicate the specific content type, such as story, bio, or reel, allows filtering conversions by content type in the affiliate dashboard or in connected analytics tools.
Content-Specific Tracking Links
The most advanced affiliate tracking setup uses different affiliate links for different types of Instagram content. A Story link sticker for a product demonstration gets a different tracking link than the bio link featuring the same product, which gets a different link than a direct message response to an inquiry.
This content-specific link structure allows attribution not just to Instagram overall but to specific content types, which is the data needed to determine whether Stories or Reels or bio links drive the most affiliate conversion for any specific product.
Content Analytics That Predict Affiliate Conversion
Not all Instagram engagement signals are equally predictive of affiliate conversion. Understanding which analytics are most closely associated with actual purchases focuses optimization effort on the metrics that matter most for affiliate income.
Save Rate as Purchase Intent Signal
As covered in Day 16's content types guide and throughout this series, save rate is the strongest available signal of genuine content utility. In the affiliate context, saves have a specific implication beyond general content value: when a viewer saves a post featuring an affiliate product, they are expressing enough interest to want to reference the content later, which is a direct signal of purchase consideration.
Tracking save rate separately for content featuring affiliate products, compared to the account's average save rate across all content, reveals whether affiliate product content is generating the purchase consideration signal that makes conversion likely.
Comment Content as Purchase Stage Indicator
The content of comments on affiliate product posts reveals which purchase stage commenters are in and what information they still need to convert.
Comments asking specific questions about product features, compatibility, or use cases indicate consideration-stage interest where additional information would move the viewer toward conversion. Comments asking about price or comparing to alternatives indicate high purchase intent where conversion is close. Comments sharing personal experience with the product from previous purchasers provide social proof that influences other viewers.
Tracking which specific questions appear consistently in comments on affiliate product posts identifies the objections and information gaps that, if addressed in content, would improve conversion rates.
Watch Time and Completion Rate for Affiliate Reels
As covered in Day 11's Reels strategy guide and Day 15's Reels analytics guide, watch time and completion rate are the primary Reels performance metrics. For affiliate Reels specifically, the relationship between watch time and conversion follows a specific pattern: viewers who watch through to the end of a product demonstration Reel are the viewers most likely to click the affiliate link, because they have received the full value of the demonstration.
Reel completion rate for affiliate product content is therefore a meaningful predictor of link click likelihood, making it a valuable optimization target alongside the save rate and comment quality metrics discussed above.
Analyzing Which Products Convert Best
Most affiliate marketers promote multiple products simultaneously or across time. Analytics reveals which products consistently convert and which do not, enabling strategic concentration of content effort on the highest-performing products.
Conversion Rate Comparison by Product
From the affiliate tracking system, comparing conversion rates across different promoted products reveals which products convert the Instagram audience at the highest rate. This is the most direct performance comparison available and should drive product selection and content allocation decisions.
A product with a 4 percent conversion rate from Instagram traffic consistently outperforms one with a 0.8 percent conversion rate regardless of which pays higher commission rates, because the higher volume at lower commission often produces more total income than lower volume at higher commission.
Average Order Value by Product
Commission income equals conversion rate multiplied by traffic volume multiplied by commission rate multiplied by average order value. Products with higher average order values generate more commission per conversion even at identical conversion rates. Tracking average order value alongside conversion rate for each promoted product reveals the complete revenue potential picture rather than just the conversion rate in isolation.
Product-Audience Alignment Signals
Before a product is fully tested through affiliate promotion, Instagram engagement analytics on content featuring the product provide early signals of audience alignment.
An affiliate product featured in a single informational post that generates immediate above-average save rates and substantive purchase-oriented comments is showing strong product-audience alignment signals before any link clicks are measured. These early signals are useful for prioritizing which products to invest in deeper content around before the affiliate conversion data has accumulated.
Optimizing Content Approach Based on Affiliate Analytics
With proper tracking and content analytics in place, the optimization process identifies what to do more of and what to adjust based on evidence.
Format Comparison for Affiliate Content
Different content formats produce different affiliate performance for the same products. Systematic comparison of affiliate performance across formats reveals which format the specific audience and product combination responds to most effectively.
For most affiliate products, a comparison between Stories with direct link stickers, carousels with save-optimized reference content, Reels with product demonstrations, and direct message conversations with interested followers reveals significant format performance differences.
Stories with direct link stickers typically show the highest immediate conversion rate because the link is one tap away and the audience is in an active browsing mindset. Carousels typically show the highest save rate because multi-slide educational content about products generates the reference-saving behavior that precedes considered purchases. Reels typically show the highest reach and therefore the highest absolute number of people entering the funnel even if the conversion rate per viewer is lower.
The optimal format mix for affiliate marketing typically combines all three: Reels for top-of-funnel awareness, carousels for consideration-stage education and save-building, and Stories for bottom-of-funnel conversion prompts to the already-interested audience.
Posting Time Optimization for Affiliate Content
As covered in Day 5's posting time guide and Day 21's data analysis, posting time affects early engagement velocity which in turn affects algorithmic distribution. For affiliate content specifically, posting time has an additional dimension: the time of day affects not just reach but the likelihood of conversion from reached viewers.
Research on consumer behavior suggests that purchase decisions are more likely during evening leisure time than during work hours, and more likely during weekend browsing than weekday commuting. For affiliate content where purchase intent is the desired outcome, testing posting times that target the audience's leisure browsing periods rather than their peak activity periods provides an additional optimization lever beyond standard posting time guidance.
Caption and Call to Action Testing
As covered in Day 12's caption guide, caption quality significantly affects engagement. For affiliate content, the call to action specifically deserves systematic testing because the phrasing of the conversion prompt directly affects how many interested viewers actually click through.
Testing different call to action phrasings across equivalent affiliate posts and tracking which phrasings generate higher link tap rates in Stories and bio link click rates from feed posts reveals the conversion-optimized language for the specific audience and product category.
Analytics for Multi-Platform Affiliate Strategy
Many affiliate marketers use Instagram alongside YouTube, TikTok, blogs, or email newsletters. Analytics that compare performance across platforms reveals where to concentrate effort for maximum affiliate income.
Platform Comparison Analysis
From the affiliate tracking system with platform-specific tracking links, comparing conversion rates, average order values, and total revenue by platform reveals which platforms are most productive for which product categories.
Platforms differ in their conversion characteristics in ways that are often product-specific. Long-consideration purchases like technology or significant purchases often show higher conversion from YouTube and blog content where detailed review is possible. Impulse and lifestyle purchases often show higher conversion from Instagram and TikTok where visual demonstration drives more immediate purchase decisions.
Instagram-Specific Audience for Product Selection
If platform analytics reveal that the Instagram audience converts at higher rates for specific product categories, this insight should influence product selection for Instagram specifically. Promoting products that match the specific Instagram audience's demonstrated purchase behavior produces better results than promoting the same products equally across all platforms regardless of platform-audience fit.
Using InstaPV for Affiliate Competitive Research
As covered throughout this series, InstaPV provides competitive intelligence on any public Instagram account. For affiliate marketers, this competitive research has specific applications.
Researching Successful Affiliate Accounts in Your Niche
Using InstaPV to review accounts in your niche that are known or suspected to be successful affiliate marketers reveals what content approaches are driving their performance. Reviewing their Stories and Highlights provides insight into how they present affiliate products, what formats they use for affiliate content, and how they integrate product recommendations into their broader content strategy.
This research is not about copying specific approaches but about understanding what is working in the competitive landscape and identifying the principles that underlie successful affiliate content in the specific niche.
Identifying Product Gaps in Competitor Affiliate Portfolios
Reviewing what products competitors in the niche are promoting can reveal both which products are performing well enough to be worth promoting (given that successful affiliate marketers continue promoting products that convert) and where gaps exist in the current affiliate landscape that represent differentiation opportunities.
Building a Monthly Affiliate Analytics Review
As covered in Day 19's KPI guide and Day 23's analytics-to-action guide, a structured monthly analytics review is the mechanism through which analytics translate into strategy improvements rather than remaining as passive data.
The monthly affiliate analytics review should cover conversion rate and revenue by product, identifying top performers for increased content investment and underperformers for reconsidering, content format performance comparison for affiliate content specifically, save rate and comment quality trends for affiliate product posts, any new product testing results from the previous month, and proposed optimizations for the following month based on the data reviewed.
The output of this review is a specific set of content and product decisions for the following month, each traceable to a specific data observation.
-
InstaPV: Full Feature Review and User Guide 2026
-
How to Write an Instagram Growth Strategy for Your Business in 2026
-
The Complete Instagram Analytics Glossary: 50+ Terms Explained
Frequently Asked Questions
Q: How many affiliate products should I promote at once?
This depends on niche, audience size, and production capacity. Promoting too many products simultaneously dilutes the audience trust that makes any individual recommendation effective and spreads content effort across too many products to build the depth of coverage that drives conversion. Most successful Instagram affiliate marketers in the early stages concentrate on three to five carefully chosen products that are genuinely relevant to their audience and that they have genuine knowledge of.
Q: How long should I promote a product before deciding whether it is working?
A minimum of four to six weeks of consistent content across multiple formats provides enough data for a meaningful performance assessment. Individual posts vary significantly in performance due to factors unrelated to the product, so single-post performance is not a reliable indicator. Consistent promotion across multiple content types over a sufficient period provides the aggregated signal needed for a reliable product performance assessment.
Q: Can I research which affiliate products other creators in my niche are promoting using InstaPV?
You can review the content that public accounts in your niche are posting, including any product-related content visible in their feed, Stories, and Highlights through InstaPV. What specific affiliate programs these accounts are using or what commission they are earning are private business details not visible through any public data access.
Q: How do I disclose affiliate relationships on Instagram?
Regulatory requirements for affiliate disclosure vary by jurisdiction, but the general standard in most markets including the United States requires clear disclosure that content contains affiliate links or that the creator earns commission from purchases. This disclosure should be prominent and clear rather than buried in hashtags or fine print. Instagram's own branded content tool can be used for formal partnership disclosures, and many affiliate marketers add explicit text disclosure in captions such as "this contains affiliate links" or "I earn a commission from these links."
Conclusion
Affiliate marketing success on Instagram is ultimately an optimization problem, and optimization requires measurement. The infrastructure of affiliate tracking links, UTM parameters, and content-specific link differentiation provides the measurement foundation. The analytics framework covering save rate as purchase intent signal, comment content as purchase stage indicator, completion rate as engagement depth signal, and product-level conversion comparison provides the interpretive framework. And the monthly review process that translates these analytics into specific product and content decisions provides the compounding improvement mechanism that distinguishes growing affiliate income from stagnant income despite consistent posting.
Affiliate marketers who build and maintain this analytical practice will consistently outperform those who post affiliate content without the feedback loop that identifies what is working and concentrates effort on more of it.
Research top affiliate content accounts in your niche on InstaPV →