Introduction
Story views are one of the most visible metrics on Instagram, but also one of the most misunderstood. Most account owners glance at the view count on their Stories, form a rough impression of whether it seems high or low, and move on without ever translating that number into anything actionable.
The view count alone tells you very little. What makes Story view data genuinely useful is understanding what a given view count means in context, how it relates to other Story metrics, what it reveals about your audience relationship, and how individual Story performance connects to the overall health of your account's Stories strategy.
This guide covers everything worth understanding about Instagram Story view metrics, from the basics of what gets counted to the analytical framework for using view data to make better content decisions.Instapv
What Counts as a Story View
A Story view is recorded when an account opens your Story and the first frame begins playing. There is no minimum watch time requirement. Opening a Story and immediately swiping away still counts as a view.Read blog
This means raw view counts reflect how many accounts opened your Story rather than how many accounts actually engaged with it in any meaningful sense. The difference between view count and genuine engagement is significant and is the primary reason why view count alone is an incomplete metric.
View Count vs Reach
As covered in Day 5's reach versus impressions guide, reach and views are related but distinct metrics for Stories.
Reach counts the number of unique accounts that opened your Story. Views, or impressions, count the total number of times your Story was seen, including multiple views from the same account.
For most Stories, the gap between reach and total impressions is modest since most viewers watch a Story once rather than multiple times. However, for Stories with particularly strong content or Stories saved in Highlights that continue accumulating views over time, the gap between reach and total impressions becomes more meaningful.
When Instagram displays a view count directly on a Story during its active window, this typically reflects reach, the unique viewer count, which is the more meaningful metric for most analytical purposes.
What Is a Good Story View Count
This is the question most account owners want answered directly, and the honest answer is that good is entirely relative to your specific account size and audience engagement pattern.
A common benchmark is that typical organic Stories reach somewhere between 5 and 15 percent of an account's follower count per Story, though this varies significantly based on account size, posting consistency, content quality, and the account's relationship strength with its audience as discussed in Day 7's algorithm guide.
Smaller accounts with highly engaged, loyal audiences often achieve Stories reach well above this range as a percentage of followers. Larger accounts, where the follower base includes many passive or inactive followers, often fall below this range even with strong content.
The most useful comparison for your own Stories view count is against your own historical average rather than against external benchmarks. Consistent view counts at or above your account's average indicate healthy Stories engagement. View counts significantly below your average signal that something is affecting that specific Story's performance or that your overall Stories engagement has shifted.
The Stories View Funnel
Understanding Story view data is most useful when you think of each Story sequence as a funnel rather than looking at individual frame view counts in isolation.
For a multi-frame Story sequence, the view count typically decreases from the first frame to each subsequent frame. This decrease happens because some viewers exit the Story at each frame, either to return to the Stories bar or to exit the app entirely.
The shape of this decrease across a Story sequence reveals specific performance information.
A gradual, modest decrease across frames indicates a well structured sequence that is maintaining viewer attention from beginning to end. Some drop off at each frame is normal and expected.
A sharp drop off at a specific frame indicates that something at that point is causing a significant number of viewers to exit. This might be a frame that is visually unappealing, a transition that feels abrupt, content that does not fulfill the expectation set by earlier frames, or simply a sequence that runs longer than the content justifies.
No decrease at all, where every frame has approximately the same view count, sometimes indicates that the Story sequence is short enough that most viewers who started finished before drop off accumulated, which is generally a positive signal of appropriate sequence length.
Exit Rate and What It Reveals
Exit rate is the complement of completion rate. Where completion rate measures the percentage of viewers who watched to the end, exit rate measures the percentage who left at each specific frame.
Instagram Insights shows the number of viewers who exited at each Story frame, allowing you to identify exactly where in your Story sequences you are losing audience attention.
High exit rates at the first frame indicate that the Story content is not compelling enough in its opening to hold viewers who opened it. This often reflects a weak visual opening, unclear content purpose, or a mismatch between what the Story thumbnail suggested and what the first frame delivers.
High exit rates at a specific middle frame often indicate pacing issues, a confusing transition, or content that has not maintained the momentum established in earlier frames.
High exit rates at the final frame before the last are sometimes simply a function of sequence length, viewers who were engaged but not quite interested enough to follow through to the conclusion. Shorter sequences reduce the cumulative drop off that extends sequences generate.
Forward Taps vs Back Taps
Within each Story frame, Instagram tracks two specific interaction patterns: forward taps and back taps.
Forward taps are when a viewer taps the right side of the screen to advance to the next frame. This is the normal Story navigation action and indicates a viewer moving through the sequence.
Back taps are when a viewer taps the left side of the screen to replay the current frame or return to the previous one. Back taps are a positive signal indicating the viewer found the content compelling enough to return to rather than simply advancing.
A Story frame generating significant back tap activity is content worth noticing. It suggests the frame contained something viewers wanted to see again, which is a strong content quality signal independent of other metrics.
Story Views and Account Algorithm Standing
As covered in Day 7's algorithm guide and Day 8's Stories best practices guide, Story engagement signals influence where your Stories appear in followers' Stories bars.
The algorithm prioritizes showing Stories from accounts whose Stories a specific follower consistently watches and engages with. An account whose Stories regularly achieve high completion rates and interactive element responses will tend to appear earlier in that follower's Stories bar than an account whose Stories the follower frequently skips.
This creates a feedback loop. Strong Story content that earns good view rates and completion rates improves algorithmic placement, which increases the likelihood of future Stories being seen, which creates opportunities for more strong engagement.
Weak Story content that accumulates high skip rates or exit rates gets progressively deprioritized in the Stories bar for those viewers who consistently skip it, reducing future visibility regardless of how many total followers the account has.
This algorithmic dynamic makes Stories engagement analysis more important than a simple view count metric suggests. The quality of Story engagement, not just its volume, directly affects the account's Stories visibility over time.
Story Views for Highlights
Stories saved to Highlights continue accumulating views after the original 24-hour Story window closes. Highlight view counts reflect how many accounts have viewed the Highlight content since it was saved, which for long standing Highlights can represent view accumulation over months or years.
Highlight view data provides a different analytical picture than active Story data. The most viewed Highlights are the content that new profile visitors most commonly discover and watch, revealing which of your permanent organized content categories drives the most engagement from people exploring your profile.
Comparing view distribution across your Highlights reveals which content categories are most compelling to profile visitors and can inform decisions about which Highlights to prioritize, update, and feature most prominently in your profile structure.
Using Story View Data to Improve Performance
With the analytical framework above in place, here is how to translate Story view data into specific content improvements.
Identifying Your Strongest Opening Frames
Review your recent Stories and identify the sequences with the lowest first-frame exit rate, meaning the highest percentage of viewers who started the sequence also watched at least the second frame. Study these high retention opening frames for common characteristics. Are they visually distinctive? Do they set up a clear expectation or question? Do they communicate immediate value in the first moment?
Apply the opening characteristics of your highest retention Stories to future sequences.
Finding Your Natural Sequence Length
Review exit rate patterns across sequences of different lengths. Most accounts have a natural sequence length at which they retain the majority of engaged viewers without significant drop off. Beyond that length, cumulative drop off accumulates rapidly.
Identifying your effective sequence length and keeping most Story sequences within it maintains higher overall completion rates than regularly exceeding it with longer sequences that produce heavy mid-sequence drop off.
Leveraging High Back-Tap Content
If you notice specific Story frames generating high back-tap activity, analyze what those frames contain. High back-tap content often makes excellent material for feed posts or Reels, since the rewatching behavior suggests content value that extends beyond the Story format.
Timing Optimization
As covered in Day 5's posting time guide, publishing Stories when your audience is most active maximizes the overlap between the Story's 24-hour window and your audience's active periods. Review whether your Stories published during your audience's peak activity windows show different view patterns than those published at lower activity times.
-
How to Find and Follow Trending Topics on Instagram in 2026
-
Instagram Reels Analytics: How to Measure Success
-
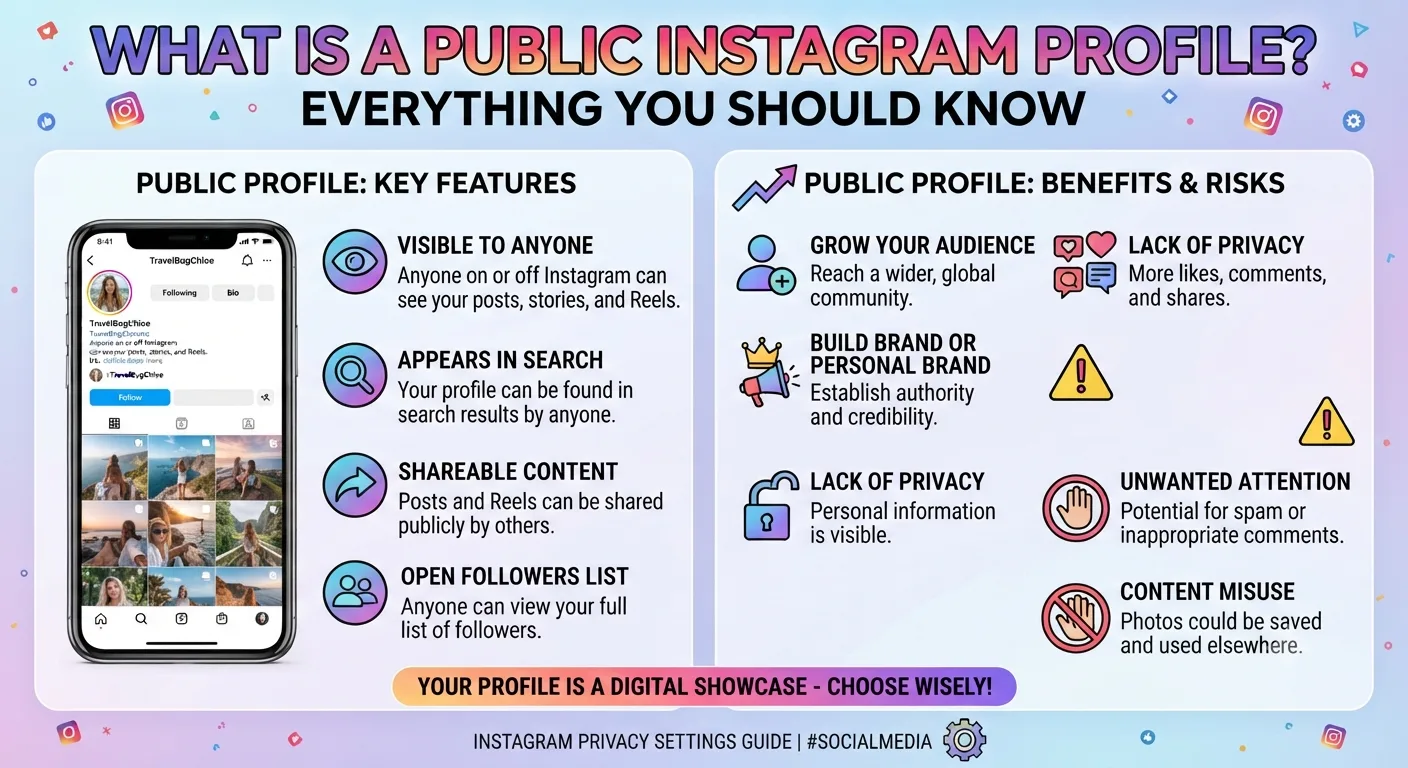
What Is a Public Instagram Profile? Everything You Should Know
Frequently Asked Questions
Q: Should I be worried if my Story views have dropped recently?
A gradual, sustained decrease in Story views over several weeks is worth investigating as a potential signal of declining Stories engagement quality or changing audience behavior. A sudden single-week drop is more likely to reflect a specific factor like a gap in posting consistency, a particularly low engagement week of content, or a period when your audience was less active. Review the pattern over at least four weeks before drawing conclusions.
Q: Do more Story views mean my account is growing?
Story views and follower growth are related but not directly correlated. Strong Stories engagement builds audience loyalty and improves algorithmic standing, which supports growth indirectly. However, as covered throughout this series, Reels are the primary direct growth mechanism while Stories primarily serve existing audience relationship rather than new audience discovery.
Q: Can I see who viewed each Story frame or only who viewed the overall Story?
During the Story's 24-hour active window, Instagram shows you a viewer list of accounts that have seen the Story, which reflects the first-frame viewers. Detailed frame-by-frame analytics including exit rates and tap data are available through the Insights view rather than the simple viewer list.
Q: Does the order I post my Stories affect their view counts?
Yes, indirectly. As covered in Day 7's algorithm guide, the algorithm places Stories in the bar based on relationship signals rather than chronological order. However, posting Stories during your audience's peak active periods, regardless of order relative to other Stories you post that day, maximizes the likelihood of each Story being seen during the period when your audience is most likely to be browsing.
Q: Can I research how Story view performance correlates with overall account growth for public accounts?
InstaPV's analytics provide follower growth trends and engagement rate data for any public account, which allows indirect assessment of how an account's overall content strategy, including Stories, is affecting their growth trajectory. Direct Story view metrics are private to the account owner and are not accessible through any third party tool.
Conclusion
Story view counts are the entry point into a much richer set of Story analytics that reveal how your audience is actually engaging with your content, where they are dropping off, what content holds attention through to completion, and how your Stories standing is affecting your algorithmic visibility over time.
The most valuable use of Story view data is comparative and longitudinal: comparing across your own content to identify patterns, and tracking changes over time to spot shifts in engagement quality before they compound into significant visibility problems.
Research Stories and overall engagement patterns for public accounts in your niche on InstaPV →