Introduction
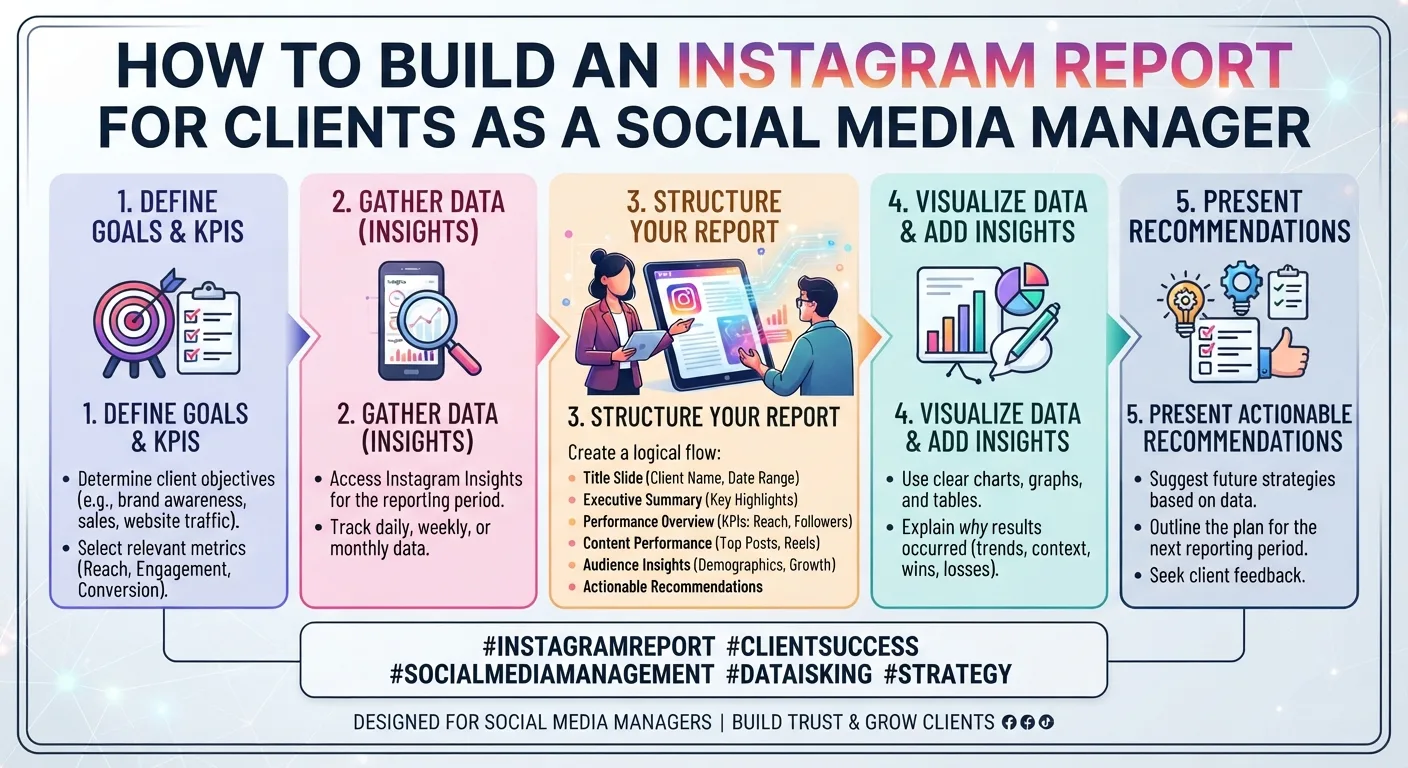
The Instagram report is one of the most important deliverables a social media manager produces. It is the primary mechanism through which clients understand the value of the work being done on their behalf, and it is often the document that determines whether a client relationship continues, expands, or ends.
A weak report, one that presents raw numbers without context or interpretation, leaves clients to draw their own conclusions from data they do not fully understand. The conclusions they draw are often not the ones that serve the account manager's interests or the client's strategic goals. A strong report tells a clear, evidence-based story about what is happening on the account, why it matters, what it means for the business, and what the plan is for the next period.Instapv
This guide covers the complete process of building an Instagram client report that demonstrates genuine value, communicates strategic intelligence, and maintains the client relationship on a foundation of evidence and transparency.
Understanding What Clients Actually Want From Reports
Before designing a report structure, understanding what clients are actually trying to learn from the report prevents the common mistake of building reports around the data that is available rather than the questions clients are asking.
Most clients ask four underlying questions through their interest in monthly reports. Is my investment producing results? Is the account growing? Is the content working? What is going to happen next?
These four questions map to the four sections that every effective client Instagram report should address: business impact, audience growth, content performance, and forward strategy. Reports that address only some of these questions leave the client with unanswered concerns that compound into dissatisfaction regardless of how strong the underlying performance data is.Read blog
Before You Build: Establishing Baselines and Goals
An Instagram report without established baselines and defined goals is just a collection of numbers. Context transforms numbers into insights.
At the start of any client engagement, establish specific, documented baselines for the metrics you will track. Record the follower count, engagement rate, average reach per post, and any available business metrics such as website traffic from Instagram on the date the engagement begins. These baselines become the reference points against which all subsequent reporting is measured.
Equally important is establishing documented goals with the client before reporting begins. What does success look like for this account? Is the primary goal follower growth, engagement improvement, website traffic, lead generation, or sales? How quickly is success expected to appear?
Documented goals prevent the retroactive redefinition of success that can occur when results do not align with unstated expectations. They also give the report a clear evaluative framework: every metric in the report exists to answer whether the account is on track toward the established goals.
Report Structure: The Seven Essential Sections
Section 1: Executive Summary
The executive summary is the most read section of any client report and the section most commonly done poorly. Many social media managers write the executive summary as a list of metrics, which misses its purpose entirely.
An executive summary should be a three to five sentence narrative that answers the four client questions at a high level. What happened this month? Is performance improving? What drove the key changes? What is the focus for next month?
A strong executive summary example reads something like: "Instagram reached 12,400 accounts this month, a 23 percent increase from October, driven primarily by two Reels that achieved significant non-follower distribution. Follower growth accelerated to the strongest rate since launch, and engagement rate improved to 4.2 percent against our 3.5 percent target. The primary driver was a shift toward educational carousel content that generated above-average saves. Next month's focus is building on this carousel performance while increasing Reel frequency to sustain non-follower discovery momentum."
This summary tells a complete, interpretable story in under 100 words without requiring the client to understand any individual metric in isolation.
Section 2: Audience Growth
The audience growth section covers follower count changes during the reporting period with appropriate context.
Present the net follower growth for the month alongside the growth rate as a percentage. Show a simple visualization of the growth trend over the reporting period, which makes it easy to see whether growth is accelerating, stable, or declining without requiring the client to interpret raw numbers across multiple periods.
Where available, include the profile visit to follow conversion rate as covered in Day 18's business metrics guide. A declining conversion rate despite consistent content quality often indicates a profile optimization issue rather than a content issue, and flagging this in the report demonstrates analytical depth that clients appreciate.
Compare current growth rate against the baseline growth rate at the start of the engagement to show the trend since work began. This comparison is often the clearest visual demonstration of the value the engagement has produced.
Section 3: Content Performance
The content performance section is where most report readers spend the most time, so clarity and scanability matter more here than anywhere else in the document.
Present the average engagement rate for the period alongside the previous period and the established target for comparison. As covered throughout this series, engagement rate is the primary metric for assessing content-audience relationship quality, and its trend over time is more informative than any single period's rate.
Present average reach per post with a breakdown of what percentage came from non-followers through Reels discovery if Reels are part of the content strategy. This distinction between follower reach and non-follower reach directly illustrates whether content is functioning as a discovery mechanism as well as an engagement mechanism.
Feature the three to five top-performing posts from the period with their individual metrics and a brief note explaining why each post performed well. This section serves two purposes: it demonstrates analytical capability by showing that performance is understood rather than merely measured, and it provides the foundation for the forward strategy section's content recommendations.
Feature one or two underperforming posts with similar analytical notes. Many social media managers omit underperformance from client reports to avoid difficult conversations. This is a mistake. Clients who see only positive results in reports become suspicious that bad results are being hidden. Clients who see honest analysis of what did not work and why develop significantly more trust in the overall reporting than those who only ever see positive framing.
Section 4: Story Performance
For clients with active Stories strategies, a brief dedicated section covering Story metrics communicates the performance of this format separately from feed content.
Present average Story views relative to followers as a rough reach percentage. Present completion rate trend if available. Highlight any Story formats or topics that generated above-average interactive element responses, since these signals are most directly tied to the relationship-building function of Stories as covered in Day 16's Story views guide.
Section 5: Business Impact
The business impact section connects Instagram activity to the business outcomes the client ultimately cares about. This is the section that most clearly demonstrates return on investment and that most directly addresses the primary client question: is my investment producing results?
For clients with trackable business metrics, include website traffic from Instagram with quality indicators such as session duration and conversion rate for that traffic segment. For e-commerce clients, include any attributable revenue or revenue-correlated metrics such as product page visits from Instagram.
For clients without sophisticated attribution tracking, this section should include the best available proxy metrics. Link in bio click rate, direct message inquiries attributed to Instagram, or other downstream actions taken by Instagram audience members that the client can observe provide some business impact signal even without full revenue attribution infrastructure.
For clients in earlier stages of their Instagram presence where direct business attribution is limited, this section should frame audience building as the current business impact, with explicit acknowledgment that relationship between audience quality and eventual business outcomes operates over longer time horizons than monthly reporting captures.
Section 6: Competitive Context
The competitive context section provides the external reference point that makes the client's own metrics interpretable as strong, average, or below-average performance rather than simply large or small numbers.
Using InstaPV to research two to three comparable competitor accounts each month, as covered in Day 9's competitor analysis guide, provides the comparison data needed for this section. Show the client's engagement rate alongside the range for comparable competitors. Show follower growth rate alongside comparable competitors.
This section transforms the client's metrics from absolute numbers that are hard to evaluate in isolation into relative performance measures that have clear meaning. A client whose engagement rate is 4.2 percent may not know whether to be pleased or concerned without knowing that comparable competitors average 2.1 to 3.5 percent.
Section 7: Next Month Strategy
The forward strategy section is where the report becomes a planning document rather than purely a historical record. It demonstrates that the preceding analysis has produced specific strategic direction rather than just performance documentation.
Based on the content performance analysis, specify what content themes, formats, and approaches the next month will emphasize and why. Reference the specific performance data that supports each strategic direction. If carousel content generated above-average saves this month, specify that carousel production will increase next month and explain the specific hypothesis about why this increase is expected to drive further improvement.
If anything needs to change in the strategy, explain why the change is warranted with reference to specific performance signals. A strategy change that is grounded in performance evidence is a demonstration of analytical capability. A strategy change without clear rationale creates the impression that the strategy is being made up as it goes.
Data Sources and Collection
Collecting the data for a monthly client report requires drawing from several sources, and establishing efficient collection processes saves significant time across the year.
Instagram Insights
For owned account metrics including engagement rate, reach, impression breakdowns, Story analytics, and audience data, Instagram Insights is the primary source as covered in Day 16's Insights guide. Access requires a business or creator account and direct account access.
InstaPV for Competitive Context
InstaPV's analytics provide the competitive context data for the report's competitive section, as covered throughout this series. Searching competitor accounts on InstaPV and recording their current follower count and engagement rate each month takes approximately fifteen minutes for a typical competitor set of three to five accounts.
Website Analytics
For the business impact section, Google Analytics or the client's preferred analytics platform provides Instagram-sourced traffic data. Ensure UTM parameters are configured on all Instagram links as covered in Day 18's business metrics guide so that Instagram-sourced traffic can be accurately attributed and analyzed separately from other sources.
Data Export
For efficiency, use the CSV export functionality from InstaPV Pro and Instagram Insights where available to pull data into a master tracking spreadsheet rather than manually recording each figure individually each month.
Report Design and Presentation
The visual presentation of a client report affects how the information is received and how professional the relationship feels, even when the underlying data and analysis are identical.
Consistency
Using a consistent report template each month, as covered in Day 5's PDF reporting guide, reduces production time and creates the familiar structure that clients come to navigate efficiently. A client who knows exactly where the engagement rate data appears in the report every month reads reports faster and retains the information more effectively than one who must relocate different sections in a different layout each month.
Visualizations
Charts and graphs communicate trends more efficiently than tables of numbers for most clients. A simple line graph showing engagement rate over the last six months communicates the trend far more immediately than a table of six monthly figures. Keep visualizations simple, clearly labeled, and directly tied to the surrounding text rather than presenting them as standalone data exhibits that require independent interpretation.
Length
Most client reports should be between four and eight pages. Shorter reports signal insufficient depth of analysis. Longer reports signal poor prioritization of what matters most. The seven sections above can be covered comprehensively within this range for most accounts.
Format
PDF is the standard delivery format for client reports as covered in Day 5's PDF reporting guide. It ensures consistent formatting across devices and creates a permanent record that clients can file and reference.
Presenting the Report to Clients
For significant engagements, presenting the report in a brief monthly meeting rather than delivering it asynchronously dramatically increases the value the client extracts from the data and the impression of analytical capability the report creates.
A 30-minute monthly review meeting where the report is walked through section by section gives clients the opportunity to ask questions about the data, understand the strategic implications, and participate in the forward planning. Clients who understand their own Instagram performance through this kind of regular briefing are significantly more likely to trust the strategy recommendations and continue the engagement than those who receive reports without explanation.
-
The Science Behind Instagrams Algorithm: What We Know in 2026
-
InstaPV Pro vs Free: Which Plan Is Right for You?
-
10 Instagram Accounts to Follow for Social Media Inspiration
Frequently Asked Questions
Q: How do I handle a month where performance declined significantly?
Honesty with clear analytical explanation and a concrete forward plan is consistently the most effective approach. Clients who discover that a social media manager is hiding poor performance are far more likely to terminate the relationship than clients who receive an honest assessment of what happened and a clear plan for addressing it. Frame the decline in the context of the overall trend since the engagement began and explain the specific factors that affected this month's performance with evidence where available.
Q: Should I include every available metric in the client report?
No. Including every available metric creates confusion about what matters most and buries the key insights in a sea of less important data. Select the five to eight metrics most directly connected to the established goals and present these comprehensively rather than presenting every available metric at shallow depth.
Q: How do I explain Instagram metrics to clients who are not familiar with the platform?
Build brief metric definition glossaries into the first report and reference them as needed in subsequent reports. Define engagement rate, reach, impressions, and any other technical terms in plain language the first time they appear. Clients who understand what they are being shown engage much more constructively with the reporting than those who nod along without genuine comprehension.
Q: Can I use InstaPV data in client reports?
Yes. InstaPV's analytics data for public accounts can be used in client reports for competitive context sections. Noting that competitive benchmark data is sourced from publicly available analytics through InstaPV provides appropriate transparency about the data source.
Conclusion
A well-built Instagram client report does significantly more than document what happened last month. It demonstrates analytical capability that justifies the engagement. It builds client trust through transparency and honest assessment of both successes and challenges. It provides the strategic context that makes the next month's work purposeful rather than reactive. And it maintains the client relationship on a foundation of evidence and shared understanding that sustains engagements through inevitable performance fluctuations.
The seven-section structure in this guide, built around the four questions clients are actually asking, produces reports that serve all of these functions simultaneously rather than being purely data delivery documents that clients read once and file away.
Use InstaPV for competitive context data in your monthly client reports →