Introduction
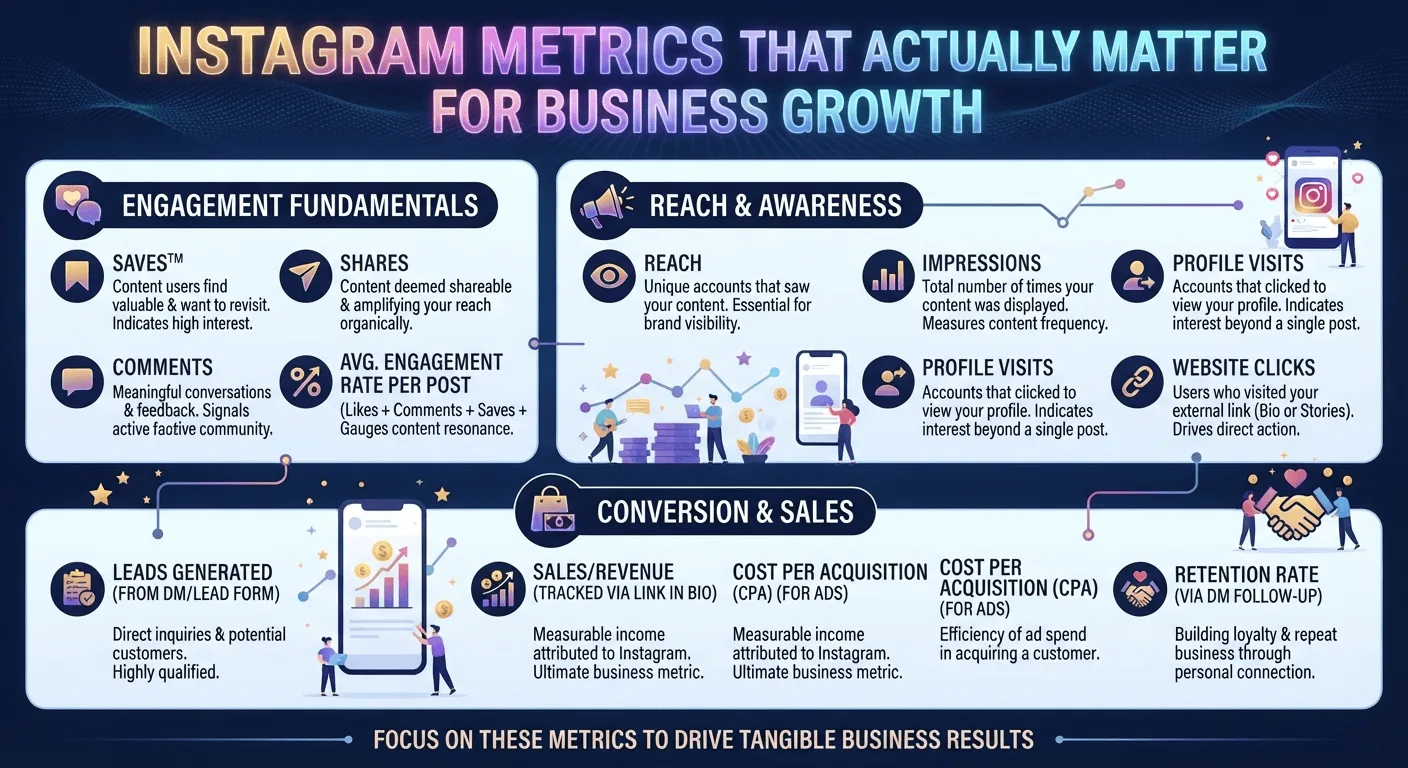
Instagram generates an overwhelming amount of data. Every post, Story, Reel, and profile interaction produces numbers that can be tracked, reported, and obsessed over. The problem is not a shortage of metrics. The problem is that most of the metrics that get the most attention are the ones least connected to actual business outcomes.
Follower count is the most visible number on any Instagram profile and the one most commonly used to assess an account's success. It is also one of the least predictive metrics for actual business growth. A brand with 200,000 followers and a disengaged audience will consistently underperform a brand with 20,000 genuinely invested followers on every metric that translates into revenue.
This guide cuts through the noise and identifies the specific metrics that actually predict and drive business growth on Instagram, explains why each one matters, and shows how to track each one in a way that produces actionable strategic insight rather than just numbers on a dashboard.Instapv
The Vanity Metric Problem
Before covering the metrics that matter, it is worth being explicit about which ones do not, and why this distinction matters so much.
Vanity metrics are numbers that look impressive in reports and feel good to see growing but have weak or no connection to actual business outcomes. They are not entirely useless since they provide some directional information, but they are frequently tracked at the expense of more meaningful metrics and used to justify strategic decisions they do not actually support.
Follower count is the primary vanity metric. It measures how many accounts have pressed a follow button at some point in the past without saying anything about whether those accounts are currently interested, engaged, or likely to become customers.Read blog
Total likes count is a secondary vanity metric. Individual likes require minimal effort and minimal genuine engagement with content. An account can accumulate impressive like counts from passive scrollers who tapped the heart without registering what the content said.
Total impressions is a third vanity metric when used in isolation. Impressions count how many times content was displayed without distinguishing between a viewer who engaged deeply and one who scrolled past in under a second.
None of these metrics are worth ignoring entirely, but none of them should be the primary metrics driving strategic decisions about content and growth.
Metric 1: Engagement Rate Trend
As covered extensively throughout this series beginning in Day 2's analytics guide, engagement rate is the single most important metric for assessing the health of an Instagram account's relationship with its audience.
For business growth purposes, the trend in engagement rate over time is even more important than the current rate. A brand whose engagement rate has been steadily increasing over six months has a growing, deepening audience relationship. A brand whose engagement rate has been declining even while follower count grows has an audience that is becoming progressively less interested.
Track engagement rate monthly using the formula from Day 8's engagement rate guide and maintain a simple trend line. The direction of this trend is the single most important leading indicator of whether the account's content strategy is strengthening or weakening the audience relationship that underlies all business outcomes from Instagram.
Metric 2: Website Traffic From Instagram
For most businesses, the ultimate purpose of an Instagram presence is to generate outcomes that happen off the platform, whether purchases, lead submissions, bookings, or other conversion events. Website traffic from Instagram is the most direct measurement of how effectively the account is connecting Instagram audience with the business's owned digital presence.
Track this through Google Analytics or your website analytics platform by monitoring the Social traffic source and filtering for Instagram specifically. Looking at both the volume of Instagram-sourced traffic and the behavior of that traffic once it arrives, including session duration, pages per session, and conversion rate, tells you not just how many people Instagram is sending to your website but whether those visitors are genuinely interested and likely to convert.
A high volume of Instagram-sourced traffic with a high bounce rate and low conversion rate suggests the audience Instagram is attracting is not well aligned with the business's actual customer profile. A lower volume of Instagram traffic with a strong conversion rate suggests a more precisely aligned audience that is highly commercially relevant despite its smaller size.
Metric 3: Story Completion Rate
As covered in Day 16's Story views guide, completion rate measures what percentage of viewers who started a Story sequence watched it all the way to the end. For business accounts using Stories to communicate key messages, demonstrate products, or move audiences toward conversion, completion rate is directly predictive of how effectively that communication is actually reaching the audience.
A story about a product promotion that 80 percent of viewers exit before the call to action is not effectively delivering the commercial message regardless of how many views the first frame accumulates. Tracking completion rate for commercially important Story content reveals whether the narrative structure is holding attention long enough to deliver its purpose.
Metric 4: Save Rate
Save rate, the percentage of viewers who save a post relative to those who saw it, is one of the strongest indicators of content that provides lasting reference value. As covered throughout this series, saves are heavily weighted in Instagram's algorithm and are a strong predictor of sustained reach beyond the initial posting window.
For business accounts specifically, high save rates on product, educational, or service content indicate that viewers are treating the content as genuinely useful reference material rather than passive entertainment. This level of engagement is strongly predictive of the kind of ongoing audience investment that eventually translates into purchase intent and conversion.
Track save rate as a percentage of reach rather than as an absolute number so it remains comparable across posts of different reach levels. Average save rate across your recent content provides a meaningful benchmark, and tracking whether this average is improving over time is a stronger strategic signal than any individual post's save count.
Metric 5: Profile Visits to Follower Conversion Rate
Every time someone discovers your content through Reels, Explore, or sharing and visits your profile, they make a decision about whether to follow. The percentage of profile visits that result in a follow is your profile conversion rate, and it is a direct measure of how effectively your profile is making the case for following.
As covered in Day 6's bio optimization guide and Day 12's profile audit framework, your bio, profile picture, Highlights structure, and overall visual consistency all contribute to this conversion. A low profile visit to follower conversion rate, where many people discover your content but few follow, indicates a profile presentation problem that needs addressing before investing further in content reach.
Improving this conversion rate is often more efficient than increasing reach, since it multiplies the value of every discovery event that is already occurring rather than requiring additional investment to generate more discovery.
Metric 6: Link in Bio Click Rate
For businesses driving traffic from Instagram to specific destinations, the link in bio click rate measures how effectively the account is converting profile visitors into website visitors. This is distinct from the broader website traffic metric since it specifically reflects how well the profile's call to action and link destination are aligned with visitor intent.
A low click rate on the bio link, despite reasonable profile visits, often reflects either a weak call to action in the bio or a link destination that does not match what profile visitors expect to find. Both are fixable through the bio optimization approach covered in Day 6.
Metric 7: Reach to Follower Ratio for Reels
As covered in Day 15's Reels analytics guide, the percentage of Reel reach that comes from non-followers through the Reels tab and Explore page is the most direct measure of whether Reels are functioning as a growth mechanism. A consistently high proportion of Reel reach coming from non-followers indicates the algorithm is actively distributing content to new audiences, which is the primary mechanism of organic follower growth.
For business accounts whose Instagram growth strategy depends on expanding their audience, this metric directly measures whether that expansion is happening through the format designed for it.
Metric 8: Comment Sentiment Quality
This is a qualitative rather than quantitative metric but it is worth tracking systematically. The overall sentiment and specificity of comments across your recent content reveals the emotional relationship your audience has with your brand in a way that comment counts alone cannot.
Comment sections dominated by enthusiastic, specific, emotionally invested responses indicate an audience with genuine brand affinity that is predictive of purchase behavior and word-of-mouth advocacy. Comment sections dominated by generic or neutral responses indicate a passive audience that follows without deep brand investment.
A simple regular assessment of comment quality, asking whether comments are becoming more or less specific, more or less enthusiastic, and more or less personally invested over time, tracks the depth of audience relationship that underlies business outcomes even when it is not captured by any single numeric metric.
Metric 9: Instagram Sourced Revenue or Leads
For businesses with the tracking infrastructure to attribute revenue or leads to specific acquisition channels, Instagram sourced revenue or leads is the ultimate downstream business metric. It directly answers whether Instagram is contributing to business growth in the most concrete possible terms.
Setting up this attribution tracking typically requires UTM parameters on Instagram links, proper channel attribution in your CRM or analytics platform, and in some cases discount codes or dedicated landing pages for Instagram-sourced traffic that allow offline attribution alongside digital tracking.
Not every business has the infrastructure for precise Instagram revenue attribution, but building toward it is worth prioritizing since it provides the clearest possible accountability for Instagram investment and the strongest possible basis for budget allocation decisions.
Metric 10: Follower Quality Score
Rather than simply tracking follower count, calculating a composite follower quality score that combines engagement rate, save rate, and website conversion rate for Instagram-sourced traffic provides a more meaningful measure of audience value than any single metric alone.
A simple version of this might weight engagement rate at 40 percent, save rate at 30 percent, and Instagram-sourced website conversion rate at 30 percent to produce a single composite quality score that can be tracked over time. A rising quality score indicates that the audience being built is increasingly commercially valuable. A falling quality score despite growing follower counts indicates an audience whose quality is diluting even as its size increases.
Building a Business Growth Metrics Dashboard
Bringing these metrics together into a single tracking document, updated monthly, creates a business growth dashboard that tells a coherent story about Instagram's contribution to business outcomes rather than a collection of disconnected numbers.
The dashboard structure might include a growth section tracking follower count trend and Reel non-follower reach percentage, an engagement section tracking engagement rate trend and save rate average, a conversion section tracking profile visit to follow rate and link click rate, a downstream section tracking website traffic volume and conversion rate from Instagram, and a quality composite section showing the follower quality score.
Reviewing this dashboard monthly and asking which metrics are improving, which are declining, and what specific content or strategy decisions explain each change produces the kind of evidence based strategic insight that converts Instagram activity into genuine business growth rather than just social media presence.
Frequently Asked Questions
Q: How do I track these metrics if I do not have a business or creator account?
As covered in Day 16's Instagram Insights guide, most of the private metrics in this guide, including reach, impressions, saves, and profile visits, require a business or creator account to access through Instagram Insights. For personal account owners, switching to a creator account is free and reversible and provides access to the analytics infrastructure needed to track these metrics.
Q: Which of these metrics should I focus on first if I am just starting to take Instagram analytics seriously?
Start with engagement rate trend and website traffic from Instagram since these two metrics provide the most immediate strategic clarity. Engagement rate tells you whether your content strategy is building or eroding audience relationship. Website traffic tells you whether Instagram is connecting with your actual business. Both are accessible without sophisticated tracking infrastructure and both provide clear strategic direction.
Q: Can I track these metrics for competitor accounts to benchmark my own performance?
Some of these metrics, specifically those based on private data like saves, profile visits, and website traffic, are not accessible for accounts you do not own. For competitive benchmarking, follower growth trends and engagement rate data available through InstaPV for any public account provide the most accessible and meaningful comparison points.
Q: How do I know if my engagement rate is actually good for my specific business type and niche?
Using InstaPV to check the engagement rate trends of comparable accounts in your specific niche and business category provides the most relevant benchmark. As covered in Day 8's engagement rate guide, benchmarks vary by both account size and niche, so comparing against accounts in your specific space is more meaningful than comparing against general Instagram averages.
-
How to Create Viral Instagram Stories (With Real Examples)
-
What Are Instagram Close Friends Stories and How to View Them?
-
How to Monitor Your Brand Mentions on Instagram for Free
Conclusion
The metrics that matter for business growth on Instagram are those that measure the depth of audience relationship, the effectiveness of content in driving action, and the downstream business impact of Instagram activity. Follower count, likes, and total impressions are visible and emotionally satisfying to track but are poor predictors of the outcomes that actually matter.
Building a consistent monthly tracking practice around engagement rate trend, save rate, profile conversion, website traffic quality, and downstream revenue contribution creates the analytical foundation for making Instagram strategy decisions that genuinely drive business growth rather than simply social media metrics.
Research engagement and growth benchmarks for accounts in your niche on InstaPV →