Introduction
If you manage Instagram for a business, a client, or even just your own brand, at some point you will need to communicate performance in a format other than "here's the analytics dashboard, take a look." Stakeholders, clients, and team members often need a clear, presentable summary of what is happening on Instagram without needing to navigate an analytics interface themselves.
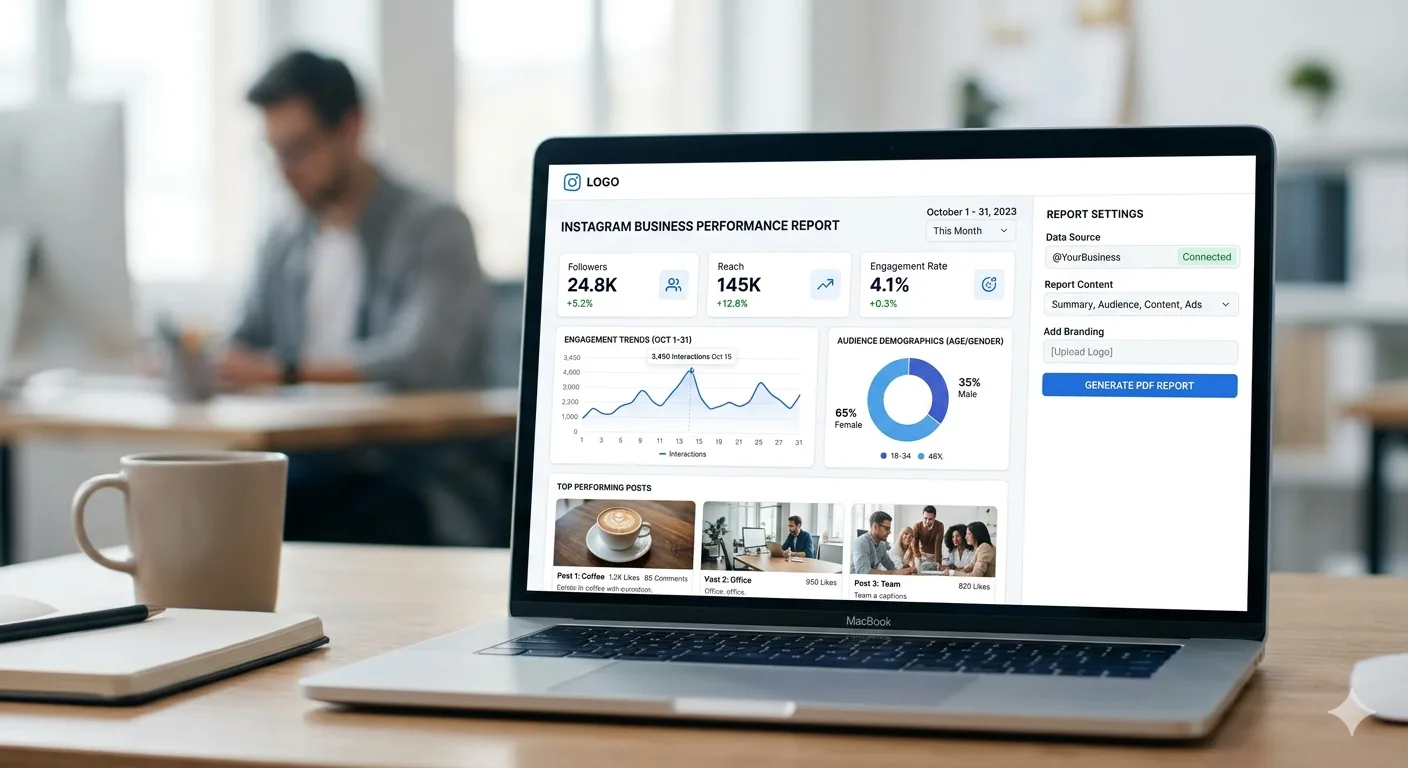
This is where PDF reports come in. A well-structured Instagram PDF report turns raw data into a digestible narrative: how the account is growing, what content is working, how engagement compares to previous periods, and what the data suggests for the next phase of strategy.
The challenge for many social media managers and small business owners is that generating these reports manually taking screenshots, copying numbers into documents, formatting charts is tedious and time-consuming, especially on a recurring basis.
This guide covers what should go into an effective Instagram PDF report, how to generate one efficiently using InstaPV alongside Instagram's native tools, and how to structure reports for different audiences.
Why Instagram Reports Matter
Before getting into the how, it is worth establishing why investing time in proper reporting pays off.
Clients Need to See Value
For agencies and freelancers managing Instagram on behalf of clients, regular reporting is often the primary way clients perceive the value of the service being provided. A client who never sees data may assume nothing is happening, even if the account is performing well. A clear report makes progress visible and tangible.
Stakeholders Need Context, Not Raw Data
Internal stakeholders executives, other departments, investors typically do not have the time or inclination to interpret raw analytics dashboards. A report that translates numbers into a narrative ("follower growth accelerated this month following our new content format, engagement rate improved by X percent") is far more useful to them than a spreadsheet of figures.
Reports Create Accountability and Historical Record
Regular reporting creates a historical record that helps identify long-term trends, justify strategy changes, and demonstrate the impact of specific campaigns or content shifts over time. Without this record, it becomes difficult to answer questions like "how has our engagement rate changed over the past six months?"
What to Include in an Instagram PDF Report
An effective report balances comprehensiveness with clarity. Here are the core sections most reports should include, with guidance on what to include in each.
Executive Summary
A brief overview typically three to five sentences summarizing the key takeaways from the reporting period. This section should be written last, after you have reviewed all the data, but placed first in the report since it is often the only section busy stakeholders read in full.
Follower Growth Overview
Total follower count at the start and end of the period, net change, and growth rate percentage. Include a visual chart showing the growth trend over the period if possible a simple line graph is often more communicative than numbers alone.
Engagement Metrics Summary
Average engagement rate for the period, compared to the previous period. Break down by total likes, comments, saves, and shares if this data is available. Highlighting whether engagement rate is trending up, down, or stable provides important context for interpreting the follower growth numbers.
Top Performing Content
A section showcasing the three to five best-performing posts of the period, with their key metrics (reach, engagement rate, saves) and a brief note on why each post may have performed well content theme, format, timing, or topical relevance.
Content Mix Breakdown
A breakdown of what types of content were published during the period by format (Reels, carousels, single images, Stories) and by theme (educational, promotional, behind-the-scenes, etc.) often presented as a simple percentage breakdown or pie chart.
Audience Insights
Where available, audience demographic data age range, gender split, top locations helps contextualize who the content is reaching and whether this aligns with target audience goals.
Competitive Context (Optional)
For reports aimed at strategic decision-making, including a brief comparison of how the account's growth and engagement compare to a small set of relevant competitors provides valuable context. This section uses publicly available competitor data rather than the account's own private analytics.
Recommendations and Next Steps
Based on the data presented, a short section outlining recommended adjustments for the upcoming period content format shifts, posting schedule changes, or areas to test further.
How to Generate the Report: A Practical Workflow
Here is a practical workflow for putting together an Instagram PDF report, combining Instagram's native Insights data with InstaPV's analytics for additional context.
Step 1: Gather Your Own Account Data
Using Instagram's native Insights tool (available for business and creator accounts), export or record the key metrics for the reporting period: follower count at start and end, total reach, total impressions, engagement totals, and top-performing posts with their individual metrics.
Step 2: Gather Competitive Context Data (If Applicable)
If your report includes competitive benchmarking, use InstaPV to check the follower growth trends and engagement rates for your tracked competitor accounts over the same period. This gives you comparative figures to include in the competitive context section.
Step 3: Organize Data Into Your Report Template
Build a reusable template in a document editor, presentation tool, or design tool structured around the sections outlined above. Having a consistent template means each reporting cycle primarily involves updating numbers and observations rather than rebuilding the structure from scratch.
Step 4: Add Visualizations
Charts and graphs communicate trends far more effectively than tables of numbers. A simple line chart showing follower growth over the period, or a bar chart comparing engagement rates month over month, makes the report significantly more digestible.
Step 5: Write the Narrative Sections
With the data assembled, write the executive summary, performance highlights, and recommendations sections. Focus on interpretation what does the data mean, and what should change as a result rather than simply restating numbers that are already visible in the charts and tables.
Step 6: Export to PDF
Once the report is complete in your document or design tool, export it as a PDF for distribution. PDF format ensures consistent formatting across devices and is the standard format for sharing reports with clients and stakeholders.
Report Templates for Different Audiences
Not every report needs the same level of detail. Here is how to adjust your approach depending on who the report is for.
Client Reports (Agency or Freelancer)
Client reports typically benefit from a balance of high-level summary and enough detail to demonstrate the work being done. Lead with the executive summary and growth highlights, include visualizations prominently, and frame recommendations in terms of what actions are planned for the next period reinforcing the ongoing value of the engagement.
Internal Stakeholder Reports
Internal reports for executives or other departments often benefit from being even more concise than client reports a one-page summary with key metrics and a brief narrative may be more effective than a lengthy detailed document, since internal stakeholders typically have less context about social media specifics and limited time.
Strategic Planning Reports
Reports intended to inform your own team's strategy can be more detailed and data-heavy, since the audience is already familiar with the account and the metrics. These reports benefit most from the competitive context section and detailed content mix analysis, since the goal is informing tactical decisions rather than communicating progress to an external audience.
Common Reporting Mistakes to Avoid
Reporting Numbers Without Context
A follower growth number of 1,200 means very little without context is that good or bad relative to the previous period, relative to competitors, relative to the account's size? Always frame numbers comparatively, not in isolation.
Overloading Reports With Every Available Metric
More data is not always better. A report that includes every metric available from Instagram Insights can overwhelm readers and obscure the metrics that actually matter. Focus on the metrics most relevant to the goals of the account and the audience of the report.
Inconsistent Reporting Periods
Comparing a 30-day period to a 31-day period, or comparing a period that includes a major holiday to one that does not, can distort comparisons. Where possible, use consistent period lengths and note any factors holidays, major campaigns that might affect comparability.
Missing the "So What"
The most common reporting mistake is presenting data without interpretation. A report that says "engagement rate was 3.2 percent this month, compared to 2.8 percent last month" is incomplete without addressing what likely caused the change and what it means for ongoing strategy.
Building a Recurring Reporting Routine
For ongoing reporting whether monthly client reports or internal strategic reviews building a routine around the report template significantly reduces the time investment required each cycle.
Maintain a Running Data Log
Rather than gathering all data at the end of each period, maintain a simple spreadsheet where you log key metrics weekly. This makes end-of-period reporting faster, since the data is already collected and you simply need to summarize and visualize it.
Reuse Competitive Benchmarks
If your reports include competitive context, maintain an ongoing tracking sheet for your competitor set using InstaPV, updated on the same schedule as your reporting cycle. This avoids needing to research competitors from scratch each time.
Template Your Narrative Sections
While the specific content of narrative sections will vary, the structure what questions each section answers can remain consistent. This makes writing the narrative sections faster over time, since you are filling in a known structure rather than starting from a blank page.
-
How to Research Competitors on Instagram Without Them Knowing
-
10 Instagram Growth Hacks That Actually Work in 2026
-
Instagram Profile Viewer: How It Works and Is It Safe?
Frequently Asked Questions
Q: What tools can I use to create the actual PDF report?
Common options include presentation software, document editors, and design tools most of which offer PDF export functionality. The specific tool matters less than having a consistent, reusable template structure.
Q: How often should I generate Instagram reports?
Monthly reporting is standard for most client relationships and internal reviews. Some situations active campaigns, rapidly growing accounts, or high-stakes periods may warrant weekly reporting, while very stable accounts might only need quarterly reports.
Q: Can InstaPV generate the entire report for me?
InstaPV Pro includes PDF export functionality for the analytics data it tracks follower growth, engagement rate trends, and posting activity for any public account. This covers a significant portion of the data needed for a report, particularly for competitive benchmarking sections, though combining this with your own account's Instagram Insights data and a narrative write-up produces the most complete report.
Q: How do I report on competitors without access to their private analytics?
Competitive benchmarking should focus on publicly available data follower growth trends, engagement rates calculated from public posts, posting frequency, and content themes. This is exactly the data InstaPV provides, and it is sufficient for meaningful competitive context even without access to a competitor's private Insights dashboard.
Q: What is a reasonable length for a monthly Instagram report?
For most audiences, two to four pages strikes a good balance between thoroughness and readability. Highly detailed strategic reports for internal planning purposes may run longer, while executive summaries for senior stakeholders may be condensed to a single page.
Conclusion
A well-structured Instagram PDF report transforms raw analytics into a clear narrative that communicates progress, context, and direction whether for clients, internal stakeholders, or your own strategic planning.
The key to sustainable reporting is building a reusable template and routine: a consistent structure, an ongoing data log, and a repeatable process for gathering competitive context through tools like InstaPV. Once this system is in place, what once felt like a tedious monthly chore becomes a streamlined process that takes a fraction of the time while delivering reports that genuinely communicate value and inform better decisions.