Introduction
There is a significant gap between having analytics data and actually using it to make better decisions. Most Instagram account owners who check their analytics regularly can tell you what their engagement rate was last month and which post got the most likes. Far fewer can tell you what specific strategy decisions those numbers informed or how their content approach changed as a result of what the data showed.
This gap between data and action is where most Instagram analytics value is lost. Analytics that inform no decisions are just numbers in a dashboard. Analytics that translate into specific content adjustments, format shifts, timing changes, and strategic direction changes are the foundation of accounts that improve systematically rather than stagnating despite regular posting.
This guide covers the complete process of translating Instagram analytics data into specific, actionable strategy decisions, from the right questions to ask of the data to the specific decisions each data pattern should trigger.Instapv
The Right Mindset: Analytics as Questions, Not Answers
The most useful shift in how to think about analytics is treating them as questions rather than answers.
When your engagement rate drops, the data is not telling you your content has gotten worse. It is asking the question: what changed that might explain this shift? When a specific post significantly outperforms your average, the data is not confirming you have figured out the formula. It is asking: what specifically about this post drove this result, and can it be replicated?
This question-first mindset prevents the two most common analytics mistakes. The first is treating data as confirming what you already believed, which leads to selective interpretation that reinforces existing approaches without genuine learning. The second is treating data as a judgment on the account rather than a diagnostic tool, which leads to emotional responses to performance changes rather than analytical ones.
Data answers the what. Your interpretive work answers the why. Strategy decisions follow from the why.Read blog
The Translation Framework: From Data to Decision
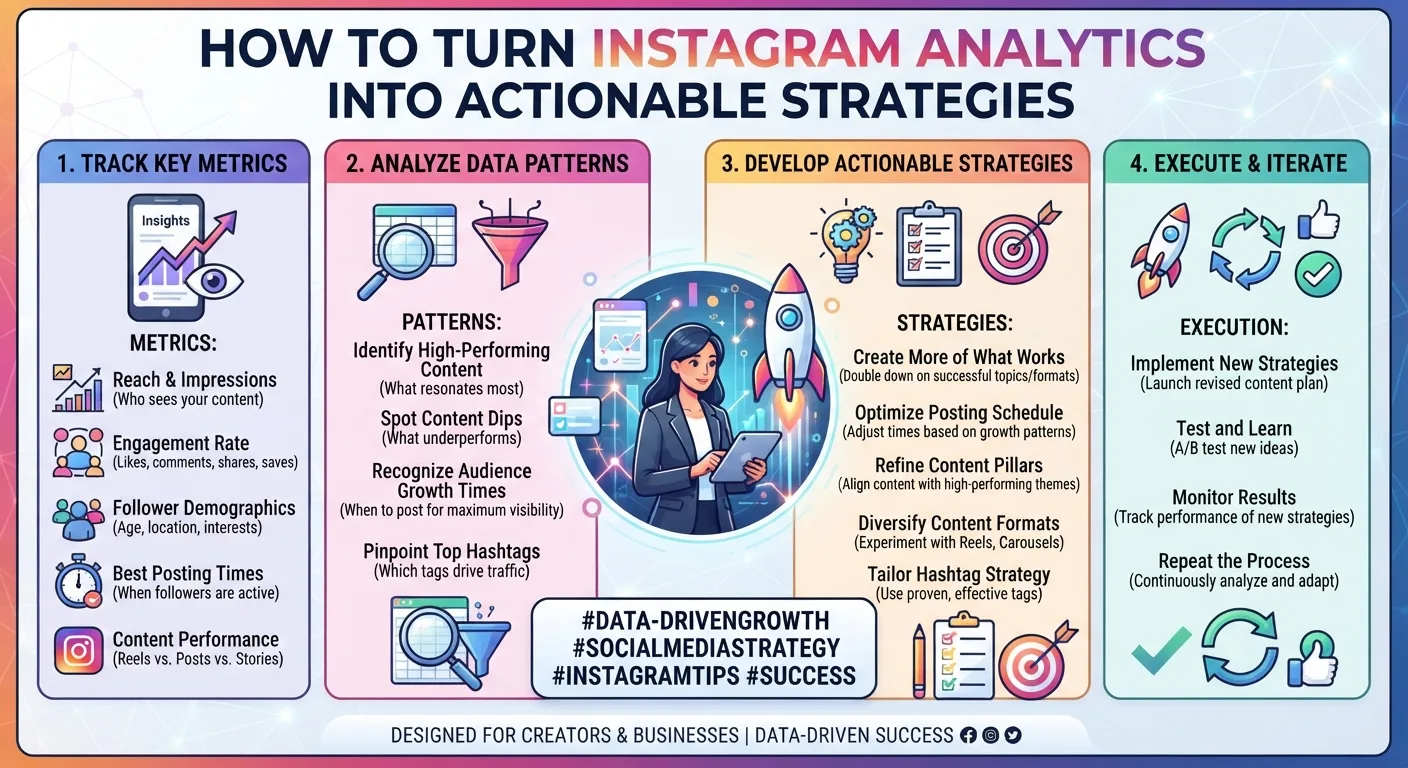
Turning any analytics observation into an actionable strategy decision follows a consistent four-step process.
Step 1: Observe the Pattern
The first step is identifying what the data actually shows, described as precisely as possible without interpretation. Not "engagement is lower this month" but "average engagement rate across the last twenty posts is 2.1 percent, compared to 3.4 percent in the previous twenty-post period, with the decline concentrated in single-image posts while carousel engagement remained stable."
This precision matters because vague observations lead to vague strategies. The more precisely you describe what the data shows, the more specifically you can identify what might be causing it and what to do about it.
Step 2: Generate Hypotheses
For any observed pattern, generate two or three specific hypotheses about what might be causing it. Multiple hypotheses prevent premature conclusion-jumping, which is the most common analytical mistake.
Using the example above, hypotheses might include: single-image content quality has declined relative to the previous period, single-image format is becoming less effective with the audience as carousel content becomes more prominent, a change in posting time for single-image posts is affecting early engagement velocity, or the topics chosen for single-image posts have drifted from what the audience responds to most strongly.
Step 3: Test the Most Likely Hypothesis
Choose the hypothesis that best fits all available evidence and design a specific test that would confirm or refute it. The test should be simple enough to run within a normal content schedule rather than requiring a complete pause of regular publishing.
For the hypothesis that single-image format is declining in effectiveness, the test might be: over the next four weeks, replace half of the planned single-image posts with carousels on the same topics and compare engagement rates across the two formats.
Step 4: Adjust Based on Results
After the test period, review whether the results confirm or refute the hypothesis. If the carousel posts outperform the single-image posts significantly, the format shift is warranted and should be incorporated into ongoing strategy. If the formats perform similarly, the format was not the cause and a different hypothesis should be tested.
This hypothesis-test-adjust cycle is the core mechanism through which analytics translate into genuine strategy improvement rather than just data collection.
Translating Specific Metrics Into Specific Decisions
Different metrics call for different strategic responses. Here is how to translate each major metric category into specific decisions.
Declining Engagement Rate
As the most important overall performance metric covered in Day 2's analytics guide and Day 18's business metrics guide, a declining engagement rate trend is the most significant signal requiring strategic response.
The questions to ask: Is the decline affecting all content types equally, or is it concentrated in specific formats? Has follower count grown significantly in the same period, which naturally dilutes engagement rate as covered in Day 8's engagement rate guide? Has posting frequency changed in ways that might affect audience engagement patterns? Has content topic mix shifted in ways that moved away from what the audience responds to most strongly?
The decisions that typically follow: Increase the proportion of educational and save-worthy content, which consistently generates stronger engagement signals as covered in Day 21's Week 3 recap. Review and improve caption closing questions for specificity. Check posting times against audience activity data and adjust if timing has drifted from peak windows. Compare recent topic distribution against the highest-engagement posts from earlier periods to identify any drift from what worked.
Low Save Rate
Save rate is one of the most directly actionable metrics because the reason for low saves is almost always identifiable: content is not valuable enough to the audience to be worth keeping for later reference.
The questions to ask: What proportion of recent content is educational, reference-worthy, or practically useful versus entertainment-oriented or purely aspirational? Are captions structured to deliver information in a format viewers would want to return to? Are post topics matched to genuine audience information needs or primarily to what is easy to create?
The decisions that typically follow: Shift content mix toward educational, how-to, and reference formats as covered in Day 16's content types guide. Restructure carousels to present information in a format that is genuinely useful for reference. Review the specific topics that have generated highest saves in the past and create more content in those areas.
Low Story Completion Rate
As covered in Day 16's Story views guide and Day 8's Stories best practices guide, low completion rate indicates viewers are dropping off before the end of Story sequences.
The questions to ask: How long are typical Story sequences? Where specifically are viewers dropping off, which Insights shows through per-frame analytics? Are opening frames compelling enough to establish a reason for viewers to continue? Is the content in middle frames maintaining the promise established in the opening?
The decisions that typically follow: Shorten Story sequences to remove frames that do not add clear value. Strengthen opening frames with more immediately compelling content. Ensure middle frames maintain the momentum rather than losing focus. Test different Story formats to identify which hold completion best for the specific audience.
Reels With High Views But Low Follower Conversion
This pattern, where Reels reach many people but few become followers, is one of the most actionable signals in Reels performance data.
The questions to ask: Does the Reel content clearly represent what the account typically covers? Does the profile communicate the account's value to someone who encountered the Reel first without prior context? Is there a clear reason visible in the Reel itself for a new viewer to follow for more?
The decisions that typically follow: Review and optimize the profile as covered in Day 6's bio optimization guide and Day 12's profile audit guide, since profile conversion is often the bottleneck when Reels reach is not converting to followers. Adjust Reel content to more clearly signal account positioning rather than being interesting as standalone content without connecting to the account's broader value.
High Reach but Low Engagement
When a post reaches many people but generates minimal engagement, the content is being shown to a large audience that is not responding to it.
The questions to ask: Is the content aligned with what the audience typically engages with, or did this reach spike come from a content type that differs from the account's core? Is the caption giving viewers a reason to engage or simply describing the image? Is the visual compelling enough to stop the scroll even if it is reaching a broader audience than usual through algorithmic distribution?
The decisions that typically follow: Improve caption engagement prompts as covered in Day 12's caption guide. Ensure content posted during reach-driven moments is aligned with the core audience interest rather than chasing reach at the expense of relevance. Review the share-to-engagement ratio to determine whether high reach with low engagement reflects content that spreads but does not resonate.
Building an Analytics-to-Action Rhythm
Individual observations are useful. A structured rhythm for translating analytics into decisions is more valuable because it produces compounding improvements rather than isolated adjustments.
The Weekly Micro-Review
A five-minute weekly check on the previous week's posts covers the most time-sensitive data points: which posts are currently performing above or below average, whether any posts warrant immediate caption updates or community engagement attention, and whether any unexpected performance patterns suggest a quick test or adjustment.
This is not a full analytics session. It is a brief scan that catches anything requiring attention before a full weekly cycle has passed.
The Monthly Analysis Session
As covered in Day 19's KPI guide and Day 10's content planning guide, a monthly analytics session of one to two hours covers the more substantive pattern analysis. Review the month's content through the translation framework above, identify the top and bottom performers, generate hypotheses about what drove each, and design specific tests for the following month.
The output of this session should be three to five specific strategy decisions for the next month, each traceable to a specific data observation and a specific hypothesis about what will improve performance.
The Quarterly Strategic Review
Every three months, step back from tactical adjustments to assess whether the account's overall direction reflects what the accumulated data shows. Are the content pillars that were defined at the start of the quarter still reflecting where the strongest performance is occurring? Is the audience that the analytics describe still the audience the strategy is designed for?
This quarterly review is where larger strategic adjustments are made: content pillar refinement, format mix overhauls, audience positioning reconsideration, and other changes that are too significant to make reactively based on a single month's data but that become clearly warranted when viewed across a longer data window.
Using Competitive Data to Contextualize Your Own Analytics
As covered throughout this series, your own account's analytics only tell you how you are performing in absolute terms. Competitive analytics from InstaPV tell you how you are performing relative to what is achievable in your niche.
If your engagement rate declined this month but competitor accounts show similar declines, the cause is likely a platform-wide or niche-wide shift rather than an account-specific strategy failure. If your engagement rate declined while comparable accounts held steady or improved, the cause is almost certainly account-specific and worth investigating seriously.
Using this competitive context in the translation framework, specifically at the hypothesis generation stage, produces more accurate diagnosis of what is actually causing performance changes and therefore more targeted strategic responses.
Documenting Decisions and Outcomes
The final and most commonly skipped component of turning analytics into actionable strategies is documentation: recording what you decided, why you decided it, and what the outcome was.
Without documentation, the valuable learning from each analytics cycle is partially lost. The insight that a specific hypothesis was tested and disproven, or that a specific content adjustment produced a significant engagement rate improvement, exists only in the analyst's memory rather than in a structured record that can be referenced in future planning cycles.
A simple decision log with columns for date, observation, hypothesis, decision taken, and outcome recorded at the next review period costs minimal additional time and produces significant long-term value as a reference for what has and has not worked in the specific account's history.
-
Instagram for Food Bloggers: Tips, Analytics, and Growth Strategies
-
Instagram Collaboration Features: How They Work and What to Track
-
10 Common Instagram Mistakes That Hurt Your Engagement
Frequently Asked Questions
Q: How much time should I actually spend on analytics each month?
The monthly analysis session described above, covering pattern identification, hypothesis generation, and decision documentation, takes one to two hours for most accounts. The weekly micro-review takes five minutes. The quarterly strategic review takes two to three hours. The total monthly time investment is approximately two to three hours, which is modest relative to the strategic value produced.
Q: What if the data suggests changes that conflict with what I want to create?
This is a genuine tension worth acknowledging. Data should inform strategy but not dictate it at the expense of creative integrity and sustainable motivation. If the data strongly suggests a content direction that you genuinely cannot sustain or that fundamentally conflicts with why you created the account, the right response is to find the best available path that serves both the data signal and your creative sustainability, not to simply follow the data regardless of personal fit.
Q: How do I know if a strategy change is working before I have enough data?
The practical answer is that four to six weeks of consistent implementation with multiple data points, typically ten to fifteen posts for format or topic changes, provides enough signal for meaningful assessment as covered in Day 8's engagement rate guide. Patterns that emerge clearly across this sample are reliable enough to act on. Patterns that remain ambiguous after this period warrant continued testing rather than premature conclusion.
Q: Should I use InstaPV data in my analytics-to-action process?
Yes. InstaPV's competitive benchmarking data is most useful at the hypothesis generation and evaluation stages of the translation framework. Understanding whether a performance change is account-specific or niche-wide, and whether the performance level you are achieving is above or below what comparable accounts are achieving, produces more accurately targeted strategic responses than internal data alone.
Conclusion
Instagram analytics data has no inherent value. Its value is created entirely in the process of translating it into specific decisions that improve future performance. The translation framework in this guide, observe precisely, generate multiple hypotheses, test the most likely, and adjust based on results, converts raw performance data into genuine strategic learning that compounds over time.
Accounts that go through this process consistently, month after month, improve their engagement rate, reach, and business impact in ways that accounts treating analytics as a reporting exercise never achieve. The discipline of letting data inform decisions, while maintaining the creative judgment to interpret it intelligently rather than mechanically, is the single most powerful competitive advantage available to any Instagram account.
Access competitive analytics data to contextualize your own performance on InstaPV →