Introduction
Of all the metrics available for Instagram Stories, completion rate is the one that most directly measures whether your Story content is genuinely holding audience attention or losing viewers along the way. It is the Stories equivalent of watch time for Reels: the metric that most closely reflects whether viewers found the content worth their continued attention from beginning to end.
Yet completion rate receives significantly less attention in most Instagram analytics discussions than follower count, reach, and overall view numbers. This is partly because completion rate data is less immediately visible than the basic view count shown directly on Stories, and partly because understanding completion rate requires engaging with Stories analytics at a slightly deeper level than most casual account owners go.
This guide covers everything worth understanding about Instagram Story completion rate: exactly what it measures, why it matters more than raw view counts for assessing Story quality, what specifically affects it, and the practical changes that most reliably improve it.Instapv
What Story Completion Rate Measures
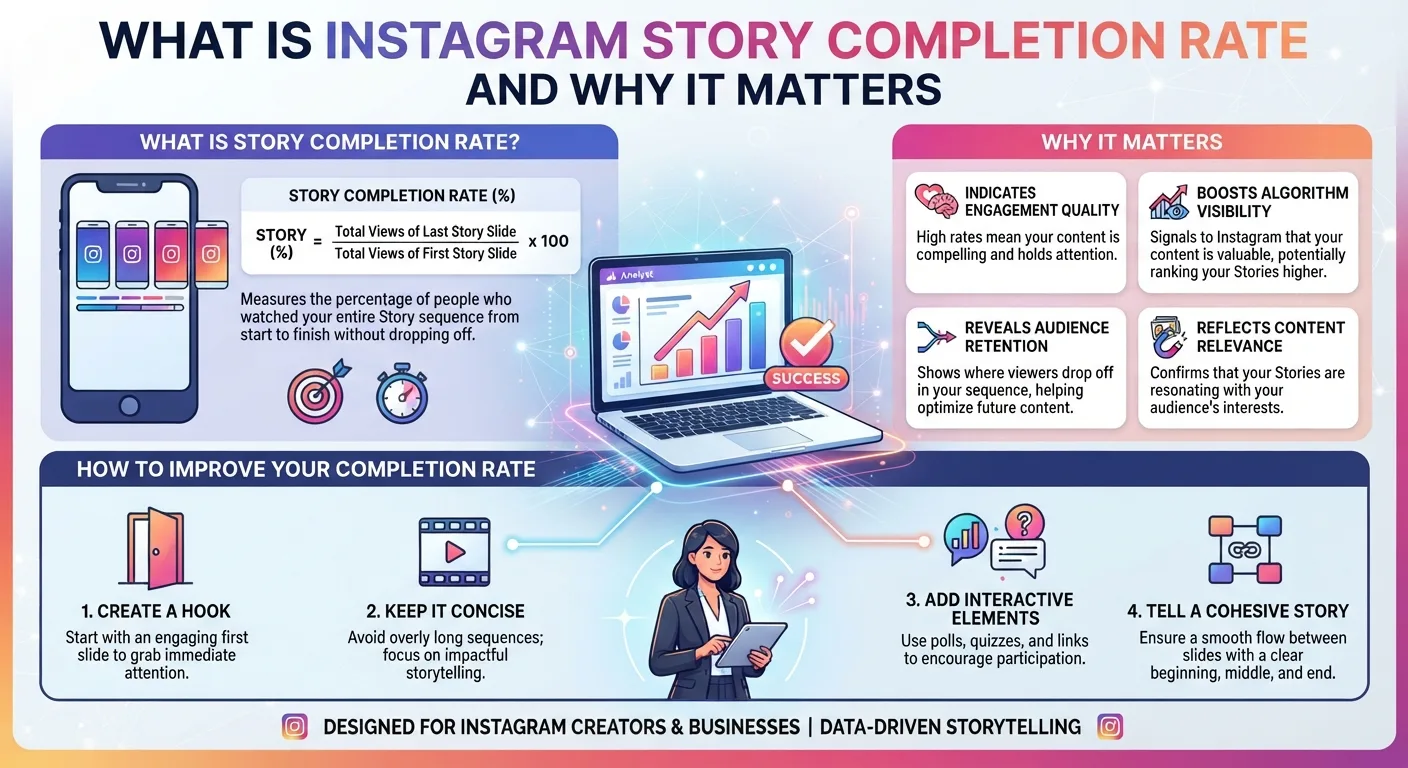
Story completion rate measures the percentage of viewers who started watching a Story sequence and watched through to the final frame.
The calculation is straightforward. Take the number of viewers who saw the last frame of your Story sequence. Divide by the number of viewers who saw the first frame. Multiply by 100 to express it as a percentage.
If 800 people saw the first frame of your Story and 560 people saw the final frame, the completion rate is 70 percent.
This calculation applies to a Story sequence rather than to individual frames in isolation. A Story you publish as a single frame has a completion rate that essentially equals the view rate since there is nothing to complete beyond the single frame. The metric becomes most meaningful and most informative for multi-frame Story sequences where viewers have multiple opportunities to drop off before reaching the end.
Why Completion Rate Matters More Than View Count
The difference between raw view count and completion rate reflects the difference between exposure and genuine engagement.
A Story with 1,000 views might have a 30 percent completion rate, meaning 700 of those viewers left before reaching the end. A Story with 600 views might have a 90 percent completion rate, meaning 540 of those viewers watched every frame. The second Story served its purpose more effectively for most goals despite reaching fewer total viewers, because it held its audience's attention throughout rather than losing the majority partway through.
This distinction matters significantly for several reasons.
Algorithm Implications
As covered in Day 7's algorithm guide, Story completion rate is one of the signals Instagram uses to determine how prominently to surface an account's Stories in followers' Stories bars. Accounts whose Stories consistently achieve high completion rates tend to appear earlier in followers' Stories bars, increasing the likelihood that followers will actually watch their Stories. Accounts whose Stories consistently show high exit rates get progressively deprioritized in the bar.
This creates a compounding effect. Accounts that consistently produce high-completion Stories maintain prominent Stories bar placement, which generates more views for each new Story, which creates more opportunities for strong completion signals, which maintains algorithmic placement. Accounts with consistently low completion rates get progressively buried in followers' Stories bars, which reduces views per Story, which reduces total completion signals, which further suppresses algorithmic placement.
Communication Effectiveness
Beyond the algorithmic effect, completion rate directly measures whether your intended communication is reaching viewers. A Story designed to deliver information, build toward a call to action, or move through a narrative arc only accomplishes these goals for viewers who watch through to the end.
A promotional Story with a call to action in the final frame that achieves 25 percent completion has failed to deliver its commercial message to 75 percent of viewers who started watching. Improving completion rate on that Story directly improves the commercial effectiveness of the content regardless of what the algorithm does with it.
Audience Relationship Signal
High completion rates across multiple Stories over time indicate that an audience genuinely finds the account's Stories worth their continued attention. This is a qualitatively different audience relationship than one where followers occasionally click on Stories out of habit or curiosity but quickly exit when the content does not hold their attention.
As covered in Day 16's Story views guide, the quality of audience engagement with Stories reflects and builds the relationship depth that drives long-term loyalty and advocacy.
What a Good Completion Rate Looks Like
As with most Instagram metrics, completion rate benchmarks vary by context. Several factors affect what a realistic completion rate looks like for any specific account.
Story Sequence Length
Completion rate naturally decreases as Story sequence length increases, simply because each additional frame provides another exit opportunity. A two-frame Story will almost always show higher completion rate than a ten-frame sequence, even if both are equally compelling frame by frame, because the cumulative probability of a viewer exiting increases with each additional step.
For typical Stories in the two to five frame range, completion rates above 70 percent are generally strong. For longer sequences of eight to twelve frames, completion rates above 50 percent are competitive. These are rough benchmarks that vary significantly by niche, account size, and audience type.
Account Size Effects
Smaller accounts with highly engaged, specifically self-selected audiences often show higher completion rates than larger accounts whose follower bases include more passive followers who followed for a single piece of content rather than deep interest in the account.
The engagement rate size relationship discussed throughout this series applies to completion rate as well. A small account with a tightly engaged community may sustain 80 to 90 percent completion on well-crafted multi-frame Stories, while a large account with a more diverse and partially passive follower base may find 50 to 60 percent competitive for equivalent content.
Content Type Effects
Not all Story content types have the same natural completion rate ceiling. Story content with high narrative drive, where later frames clearly depend on earlier ones for context, sustains completion better than disconnected frames. Interactive Stories that build toward a reveal or answer sustain completion better than static informational frames with no forward momentum.
Understanding the natural completion ceiling of different Story formats helps set realistic expectations rather than measuring all Story types against a single universal benchmark.
Accessing Your Completion Rate Data
Completion rate data is available through Instagram Insights for business and creator accounts. For each multi-frame Story, viewing the detailed Insights shows the view count for each individual frame in the sequence.
While Instagram does not display completion rate as a single calculated percentage in its current interface, calculating it from the available data is straightforward. Note the view count on the first frame and the view count on the final frame. Divide the final frame view count by the first frame view count and multiply by 100 to get the completion rate percentage.
The per-frame breakdown is more detailed than this calculation alone captures. By reviewing the view count at each frame, you can identify exactly where the largest drop-offs occur, which is more actionable information than the aggregate completion rate. A Story that loses 40 percent of its audience at frame three but retains the remaining viewers through to the end has a very different problem than a Story that loses five percent at every frame consistently.
What Causes Low Completion Rate
Understanding the specific causes of low completion rate is the prerequisite for improving it. Several distinct causes produce different types of completion problems that each require different solutions.
Weak Opening Frames
If the first or second frame of a Story sequence shows high exit rates, the opening is not compelling enough to justify continued viewing. As covered in Day 8's Stories best practices guide, the opening frame of any Story sequence is the equivalent of a Reel's hook: it determines whether viewers continue or exit before seeing the rest of the content.
An opening frame that is visually unclear, slow to communicate any value or purpose, or that fails to establish why the viewer should spend time on the following frames will lose a disproportionate share of viewers at the start, which compounds into low overall completion.
Pacing and Sequence Length Problems
If exit rates are distributed relatively evenly across frames rather than concentrated at specific points, the most likely cause is that the sequence is simply too long for the content it contains. A five-frame sequence covering content that could be conveyed in two frames creates excess viewing duration that causes gradual audience attrition through the sequence.
This is one of the most common completion rate problems because the natural instinct in creating Story content is to be thorough rather than concise. Conciseness is almost always the right instinct for Story sequences.
Content Quality Drops at Specific Points
If exit rates spike sharply at a specific frame, that frame contains something that is causing viewers to leave. This might be a frame that is visually unappealing after an engaging opening, a frame that delivers information in a dense or confusing way, a transition that feels abrupt or jarring, or a frame that reveals the Story is going in a direction the viewer did not expect or want.
The per-frame analytics available through Instagram Insights allow precise identification of these problem frames, which is genuinely actionable: once you know which frame is causing exits, you can review that specific frame and diagnose what about it is losing the audience.
Mismatch Between Story Framing and Content
If the opening frame implies a specific content direction and subsequent frames do not deliver on that implied promise, viewers who started watching based on the opening expectation will exit when they realize the content is different from what they expected.
This mismatch problem is particularly common when Story titles or opening text frames make implicit promises that the actual content does not fulfill.
Strategies for Improving Completion Rate
Strengthen Opening Frames Deliberately
As covered in Day 8's Stories best practices guide, the opening frame should immediately establish a compelling reason to continue watching. For sequential Stories, this means creating a clear sense of what is coming next, either through explicit preview such as "three things I wish I knew before" or through creating curiosity that only subsequent frames resolve.
The specific improvement to make depends on what the current opening frame lacks. If it is visually unclear, simplify the visual or improve the clarity. If it is slow to communicate purpose, move the most compelling element to the first two seconds. If it does not create forward momentum, add an explicit preview or question that makes continuing feel purposeful.
Shorten Sequences Ruthlessly
The single most reliable completion rate improvement for most accounts is shortening Story sequences to the minimum number of frames genuinely needed to deliver the content. Every frame that is not adding clear, unique value is a frame that is providing an opportunity for viewers to exit without contributing to the Story's purpose.
Review Story sequences before publishing with the specific question: does each frame add something that would be missing without it? Frames that do not pass this test should be cut, regardless of the effort that went into creating them.
Use Narrative Drive to Pull Viewers Forward
Story sequences that create genuine forward momentum, where each frame builds toward something the viewer wants to see, sustain completion better than sequences of disconnected individual frames.
The most reliable narrative structures for Story completion are question and answer formats that present a question early and delay the answer to a later frame, process reveals that show steps in a sequence where later steps depend on earlier ones for context, and countdown or list formats where the viewer knows exactly how many frames remain and is motivated to complete the sequence.
Optimize Transition Points
The transition between frames is where most Story exits occur. The transition should feel purposeful rather than arbitrary, and each new frame should open with enough visual interest and contextual clarity that viewers understand immediately why they should continue.
Opening each frame with its most compelling visual element rather than building slowly to it prevents the confusion or disinterest that causes exits at transition points.
The Relationship Between Completion Rate and Other Story Metrics
Completion rate does not exist in isolation. Understanding how it relates to other Story metrics provides more complete diagnostic insight.
High views with low completion indicates reach is working but content is not holding attention once viewers have clicked. The problem is in the Story content rather than the distribution.
Low views with high completion indicates the Story is serving viewers who watch it well but is not reaching many viewers to begin with. The problem is in Story discovery or in overall Stories strategy consistency, not in content quality.
High completion with low interactive element response indicates viewers are watching through but not engaging actively. The content is holding attention without generating the active participation that builds the deepest relationship signals.
High completion with high Story link clicks indicates a Story that is both holding attention and driving action, which is the strongest possible combination for commercially-oriented Stories.
-
How to Identify Rising Instagram Influencers Before They Go Viral
-
How to View Archived Instagram Posts and Stories (2026 Guide)
-
How InstaPV Helps Recruiters Research Candidate Instagram Profiles
Frequently Asked Questions
Q: Is completion rate more important than Story view count?
For assessing content quality and communication effectiveness, completion rate is generally more meaningful than raw view count because it measures whether the content served viewers who saw it rather than just how many saw it at all. For assessing reach and overall visibility, view count provides information completion rate does not. Both metrics together provide a more complete picture than either alone.
Q: Should I delete Stories with low completion rates?
Active Stories can be removed if low completion rate indicates genuinely poor content, but the more valuable action is analyzing what caused the low completion and applying those learnings to future Stories. Deleting does not change the algorithmic signals already generated by the poor performance, and the data from the underperforming Story is more valuable as a learning input than the decision to remove it is beneficial.
Q: Do completion rates for Highlights accumulate separately from the original Stories?
Yes. Highlight content continues generating view data after the original Story expires, and this continued engagement accumulates in the Highlight's analytics rather than returning to the original Story's metrics. Reviewing Highlight view data reveals which Highlight content continues to attract viewers over time, which is itself useful information about which archived Story content retains ongoing value.
Q: Can I see completion rate data for competitor accounts through InstaPV?
Completion rate is private analytics data visible only to the account owner through Instagram Insights. InstaPV provides publicly available follower growth and engagement rate data but cannot access private Story analytics including completion rates for accounts other than your own.
Conclusion
Story completion rate is the metric that most directly measures whether Story content is genuinely serving the viewers who watch it, rather than only measuring how many viewers begin watching. Its algorithmic implications, through the Stories bar placement effect, and its communication effectiveness implications, through measuring whether intended messages reach viewers who started the sequence, make it one of the most consequential Story metrics for any account that takes its Stories strategy seriously.
Improving completion rate requires addressing the specific causes of viewer exit in each account's specific context, whether through stronger opening frames, shorter and tighter sequences, better narrative drive, or smoother transitions between frames. The per-frame analytics available through Instagram Insights provide the precise diagnostic data needed to identify exactly where viewers are leaving, which makes completion rate improvement one of the more tractable analytics-to-action challenges available in Instagram strategy.
Research Stories engagement patterns for top accounts in your niche on InstaPV →