Introduction
Key performance indicators exist to answer one question clearly: is what we are doing working? In the context of Instagram strategy, that question breaks down into several more specific ones. Is the account reaching more people? Is the audience becoming more engaged? Is the content driving the actions that matter for the business? Is the overall trajectory positive?
The problem most Instagram managers face is not a shortage of available metrics. As covered in Day 18's business metrics guide, Instagram generates more trackable data than most people have time to analyze. The challenge is selecting the right subset of metrics to track consistently and building a monthly review process that produces genuine strategic insight rather than just a report full of numbers.
A well-designed monthly KPI tracking system covers the right metrics, tracks them consistently across comparable time periods, and produces clear directional signals that inform the next month's strategy decisions. This guide builds that system from the ground up.
What Makes a Good Instagram KPI
Before identifying which metrics to track, it is worth being clear about what qualifies a metric as a useful KPI rather than just an interesting data point.
A good Instagram KPI is directly connected to a goal that matters for the specific account and business. Tracking follower count as a KPI only makes sense if growing the audience is a genuine strategic priority. Tracking link clicks only makes sense if driving website traffic is a meaningful objective. Every KPI should trace directly to a strategic goal rather than being tracked simply because the data is available.
A good KPI is measurable consistently across time periods. Metrics that change definition based on Instagram's interface updates, that are not available for all content types, or that cannot be reliably extracted month over month create tracking inconsistencies that undermine trend analysis.Read blog
A good KPI is actionable. When the metric changes in a specific direction, it should be clear what strategic response that change calls for. A metric that goes up or down without any clear strategic implication is not worth the tracking overhead.
The Monthly KPI Framework
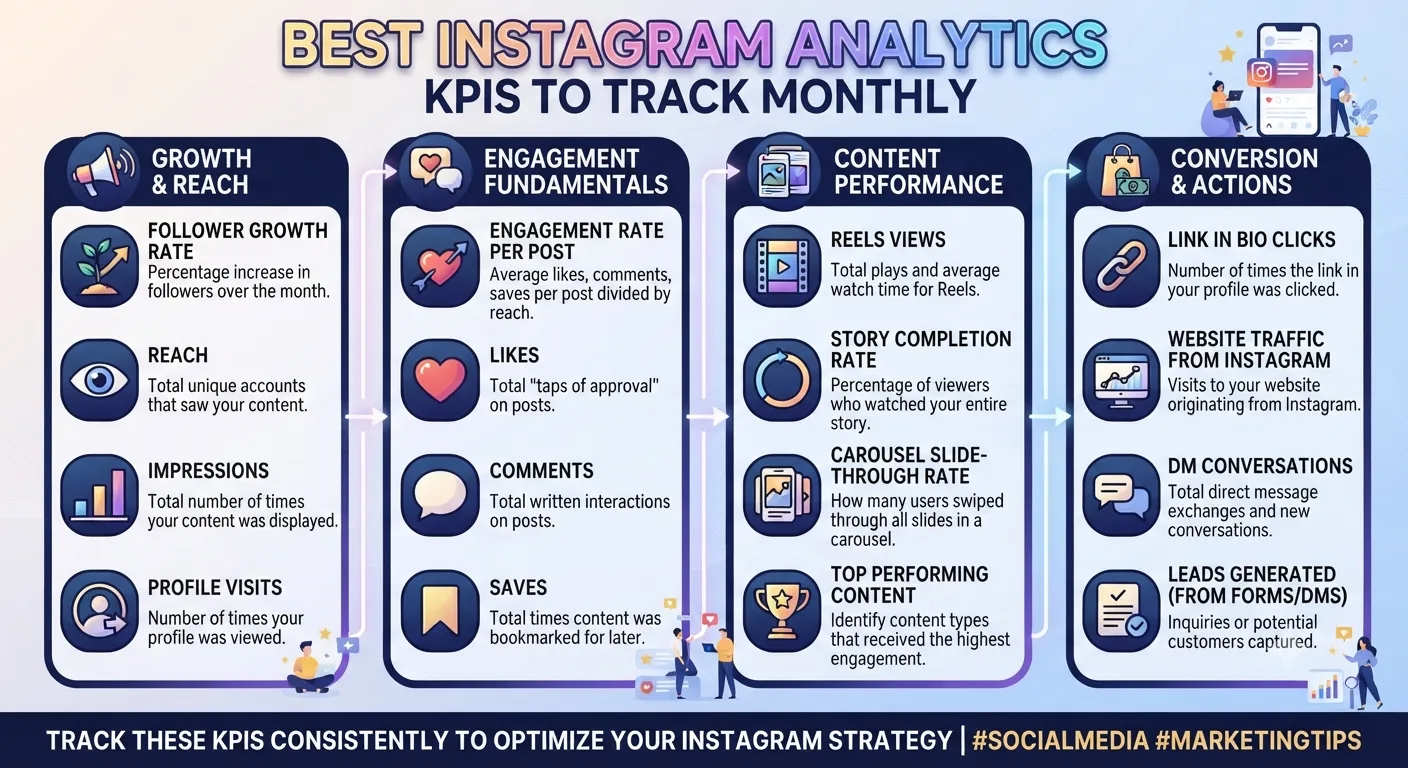
The following framework organizes Instagram KPIs into four categories that together cover the full range of strategic goals most Instagram accounts are pursuing. Choose the specific KPIs within each category that are most relevant to your specific account type and objectives rather than tracking every metric listed.Instapv
Category 1: Audience Growth KPIs
These metrics track whether the account is successfully expanding its reach and audience over time.
Net Follower Growth
Net follower growth is the difference between followers gained and followers lost during the month. This is more meaningful than gross new followers since it accounts for the churn that all accounts experience.
Record the follower count on the first and last day of each month. Calculate net growth as the difference. Calculate growth rate as the net growth divided by the starting follower count multiplied by 100.
Track this month over month and look for trends in the growth rate rather than just the absolute numbers. A consistent growth rate is healthy. A declining growth rate indicates the current strategy is losing momentum. An accelerating growth rate indicates something is working particularly well and worth identifying and doubling down on.
Non-Follower Reel Reach Percentage
As covered in Day 15's Reels analytics guide, the percentage of Reel reach coming from non-followers through the Reels tab and Explore page directly measures whether Reels are functioning as a discovery mechanism. A high non-follower reach percentage indicates the algorithm is actively distributing content to new audiences, which is the primary mechanism of organic growth.
Track this monthly by averaging the non-follower reach percentage across all Reels published during the month. Compare month over month to assess whether algorithmic distribution to new audiences is improving, stable, or declining.
Profile Visit to Follower Conversion Rate
As covered in Day 18's business metrics guide, this metric measures how effectively the profile converts discovery into follows. Calculate it by dividing the number of new followers by the number of profile visits during the month, expressed as a percentage.
This metric is particularly useful when cross-referenced with net follower growth. Strong discovery but weak conversion points to a profile presentation problem. Strong conversion but weak discovery points to a reach problem. The combination of the two metrics narrows the diagnosis significantly.
Category 2: Content Performance KPIs
These metrics track whether content is resonating with the audience and generating the engagement signals that drive both algorithmic distribution and audience relationship.
Average Engagement Rate
As established throughout this series, engagement rate is the primary indicator of content-audience relationship quality. Track the average engagement rate across all feed posts published during the month, calculated using the formula from Day 8's engagement rate guide.
Compare this against the previous month and against the benchmarks for the account's size from Day 8. A rising average engagement rate indicates the content strategy is strengthening the audience relationship. A declining rate indicates the content is becoming less resonant, which requires investigation into whether the issue is content quality, content relevance, or audience composition changes.
Average Save Rate
Save rate, calculated as average saves per post divided by average reach per post, tracks the proportion of viewers who find content reference-worthy enough to save. As covered in multiple posts throughout this series, saves are one of the most algorithmically significant engagement signals.
Track average save rate monthly across feed posts. A rising save rate indicates content is becoming more genuinely valuable to the audience. A declining save rate indicates the content is becoming less reference-worthy, which often correlates with a shift away from educational or practical content toward content that resonates in the moment without lasting utility.
Story Completion Rate
For accounts using Stories actively, average Story completion rate across the month measures whether Story content is holding audience attention through to the end of each sequence. As covered in Day 16's Story views guide, completion rate is both a content quality signal and an algorithmic factor affecting Stories bar placement.
Track this monthly and look for the format and content patterns that produce above-average completion rates versus those that produce below-average rates.
Reels Watch Time and Completion Rate
For accounts with active Reels production, average watch time and completion rate across monthly Reel output directly measures whether Reel content is holding viewer attention through to the end, which is the primary algorithmic signal for Reel distribution as covered in Day 11 and Day 15.
Track these metrics monthly and correlate against which Reel types, formats, and hooks produce above-average retention versus those that lose viewers early.
Category 3: Audience Quality KPIs
These metrics track whether the audience being built and maintained is genuinely engaged and commercially relevant.
Comment Quality Score
This is a qualitative rather than quantitative KPI but it is worth formalizing into a monthly assessment. Spend 15 minutes reading through comments on posts from the previous month and rate the overall quality on a simple five-point scale: one for comment sections dominated by generic or suspicious engagement, five for comment sections dominated by substantive, content-specific responses.
Recording this score monthly creates a trackable trend line for comment quality even though it is based on qualitative assessment rather than raw data. A declining comment quality score is often an early warning signal for audience quality problems before they show up as strongly in quantitative metrics.
Engaged Audience Growth Rate
Rather than tracking total follower growth, this metric tracks growth in the audience that actually engages with content. Estimate this by tracking the absolute number of accounts engaging with monthly content, calculated by summing unique commenters across the month's posts. While imperfect, tracking whether this number is growing alongside follower count confirms that audience quality is growing alongside audience size.
Follower Authenticity Trend
Applying the fake follower detection signals from Day 18's fake follower guide on a monthly basis, specifically checking the engagement rate trend against account size benchmarks and reviewing the follower growth chart for any unexplained spikes, maintains ongoing awareness of audience quality rather than addressing it only reactively when a partnership evaluation raises questions.
Category 4: Business Impact KPIs
These metrics track whether the Instagram presence is translating into the downstream business outcomes it exists to serve.
Website Traffic From Instagram
Track monthly sessions sourced from Instagram in your website analytics platform. Beyond the raw volume, track the quality of this traffic: average session duration, pages per session, and conversion rate for Instagram-sourced visitors relative to other traffic sources.
As covered in Day 18's business metrics guide, Instagram traffic that converts at a high rate is more valuable than higher volume Instagram traffic with a high bounce rate. Quality of downstream behavior is as important as traffic volume.
Link in Bio Click Rate
Calculate this monthly by dividing total link clicks from the Instagram profile by total profile visits during the month. This measures how effectively the profile and its call to action are converting profile visitors into website visitors, which is the final step in the Instagram to website conversion chain.
Campaign-Specific Conversion Metrics
For accounts running specific campaigns, promotions, or launches through Instagram during the month, tracking the campaign-specific conversion metrics, discount code uses, lead form submissions, or direct purchases attributed to Instagram activity provides the most concrete measure of Instagram's direct business contribution.
Return on Content Investment
For accounts with measurable content production costs, whether agency fees, photography costs, video production costs, or simply a value placed on internal time invested, calculating a monthly return on content investment provides the most executive-level accountable metric: how much business value did Instagram generate relative to what was invested in the month's content.
Building Your Monthly KPI Report
Selecting five to eight KPIs from across the four categories above, based on which are most relevant to your specific account's strategic priorities, creates a manageable monthly tracking set that covers the full range of strategic questions without becoming overwhelming.
A simple tracking template in a spreadsheet records each selected KPI for the current month alongside the previous month and a baseline from three months ago. The three-data-point view of current, recent, and baseline makes both short-term changes and longer-term trends visible simultaneously.
The monthly review session should answer three questions for each tracked KPI. Is this metric improving, stable, or declining compared to last month? What content or strategy decisions most likely explain this change? What specific adjustment should be made in the coming month based on this signal?
The output of the monthly review is not a report for its own sake but a set of specific content and strategy adjustments for the following month, grounded in what the data shows rather than what the account manager intuitively feels.
Common KPI Tracking Mistakes
Tracking too many metrics is the most common mistake. When everything is tracked, nothing is prioritized. Select the five to eight most relevant KPIs for your specific account and track only these consistently rather than attempting comprehensive coverage of every available metric.
Comparing metrics across non-equivalent time periods produces misleading conclusions. December and January are not comparable months for most accounts due to holiday patterns. A summer month is not comparable to a back-to-school month for education-adjacent accounts. Always note any significant contextual differences when comparing across months and adjust interpretation accordingly.
Reacting to single month changes rather than trends is another common mistake. One strong month does not confirm a successful strategy and one weak month does not indicate a failing one. Look for consistent directional movement across three or more months before drawing strategic conclusions from metric trends.
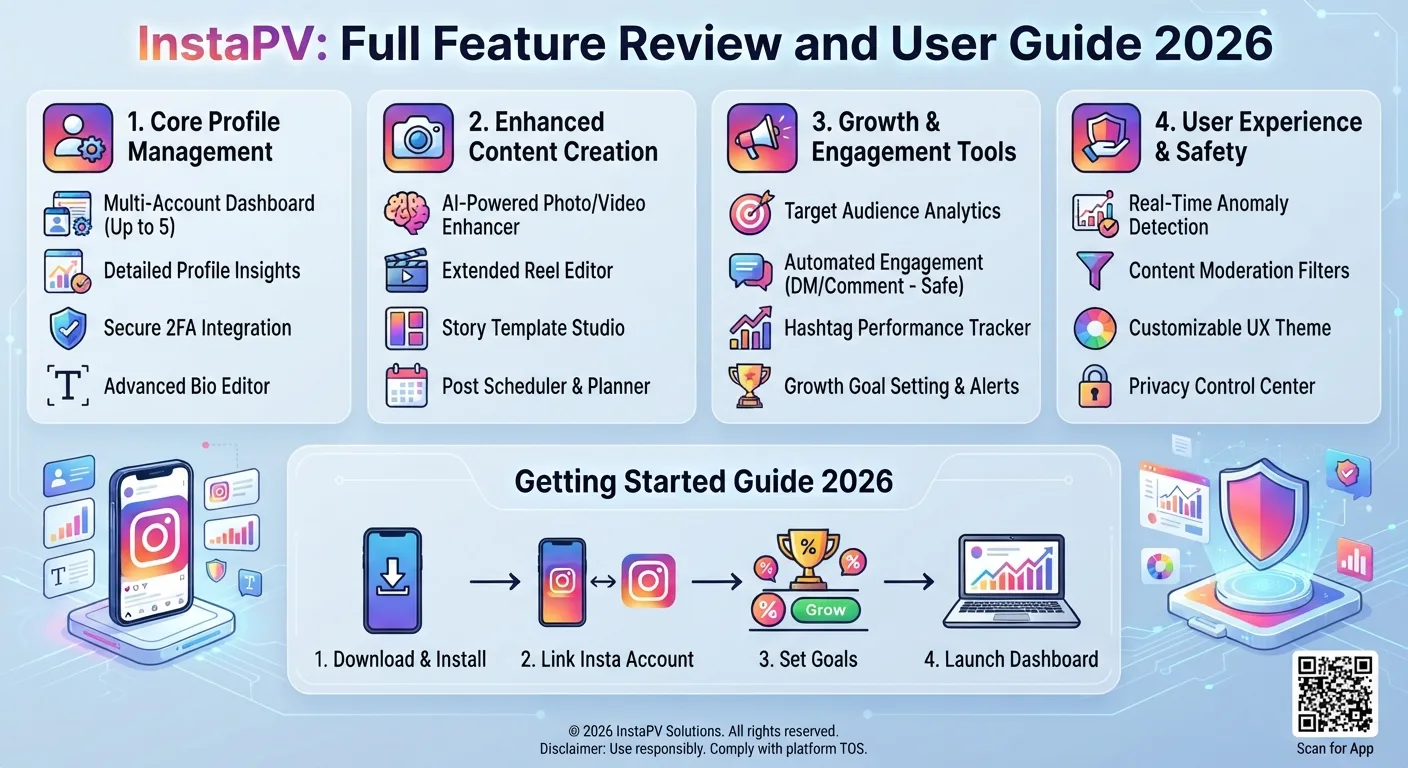
Using InstaPV to Supplement Monthly KPI Tracking
For competitive context and niche benchmarking, InstaPV's analytics provide the comparison data that your own account's internal metrics cannot supply. Checking the follower growth and engagement rate trends of three to five comparable accounts in your niche monthly gives each of your own KPIs a competitive reference point that makes the data more interpretable.
If your engagement rate declined this month but every comparable account in your niche shows the same decline, the explanation is almost certainly a platform-wide change rather than an account-specific strategy failure. If your engagement rate declined while comparable accounts held steady or improved, the explanation is almost certainly account-specific and worth investigating more seriously.
Frequently Asked Questions
Q: How long does it take to set up a monthly KPI tracking system?
The initial setup, choosing your KPIs, building the tracking template, and recording the first month of baseline data, takes two to three hours. Monthly updates after the initial setup take 30 to 60 minutes depending on how many KPIs are tracked and how complex the business impact metrics are to pull together.
Q: What if I cannot access some of these metrics because I have a personal account?
As covered in Day 16's Instagram Insights guide, most of the performance metrics in this framework require a business or creator account. Switching to a creator account is free and provides access to the analytics infrastructure needed for meaningful KPI tracking.
Q: Should I share my KPI tracking with clients or keep it internal?
For client accounts, sharing a simplified version of the monthly KPI tracking as a client report serves two purposes: it demonstrates value by making Instagram's contribution visible, and it creates accountability that keeps strategy decisions grounded in data rather than intuition. The full internal tracking can include more granular detail and competitive context that may not be appropriate for every client relationship.
Q: How do I know if my KPI targets are realistic?
Using InstaPV to benchmark against comparable accounts in your niche sets realistic targets based on what actual similar accounts are achieving rather than arbitrary goals. Engagement rate targets should reflect what high-performing accounts of your size in your specific niche are achieving, not generic platform averages that may not reflect your situation.
-
Instagram Metrics That Actually Matter for Business Growth
-
How to Use InstaPV API for Developers and Businesses
-
How to Spot Fake Instagram Followers Using Analytics
Conclusion
A monthly KPI tracking system built around the right metrics for your specific account creates the analytical infrastructure that turns Instagram activity into genuine strategic intelligence. The four-category framework covering audience growth, content performance, audience quality, and business impact ensures that the tracked metrics together answer the complete set of strategic questions relevant to any serious Instagram presence.
The investment in building and maintaining this system is modest relative to the clarity it provides. Monthly reviews grounded in consistent data produce better strategy decisions than intuition-based approaches, and those better decisions compound over time into meaningfully better Instagram outcomes.
Use InstaPV for competitive benchmarking to set realistic monthly KPI targets →